
|
Renaissancere Holdings Ltd. (RNR) تقييم DCF |
Fully Editable: Tailor To Your Needs In Excel Or Sheets
Professional Design: Trusted, Industry-Standard Templates
Investor-Approved Valuation Models
MAC/PC Compatible, Fully Unlocked
No Expertise Is Needed; Easy To Follow
RenaissanceRe Holdings Ltd. (RNR) Bundle
اكتشف الإمكانات الحقيقية لـ Renaissancere Holdings Ltd. (RNR) مع حاسبة DCF المتقدمة! اضبط الافتراضات الرئيسية ، واستكشف السيناريوهات المختلفة ، ودرس كيف تؤثر التغييرات المختلفة على تقييم Renaissancere - كل ذلك ضمن قالب Excel شامل واحد.
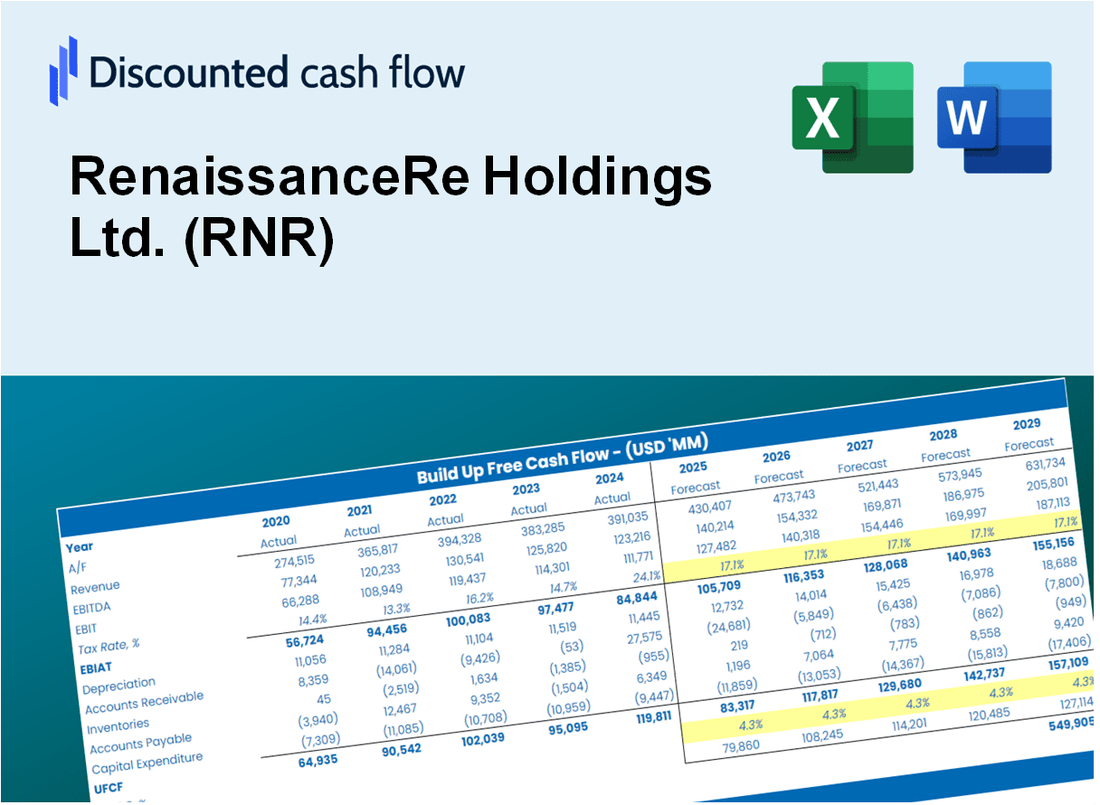
Discounted Cash Flow (DCF) - (USD MM)
| Year | AY1 2020 |
AY2 2021 |
AY3 2022 |
AY4 2023 |
AY5 2024 |
FY1 2025 |
FY2 2026 |
FY3 2027 |
FY4 2028 |
FY5 2029 |
|---|---|---|---|---|---|---|---|---|---|---|
| Revenue | 5,155.1 | 5,265.4 | 5,049.2 | 9,091.1 | 11,648.1 | 14,740.9 | 18,655.0 | 23,608.4 | 29,877.0 | 37,810.1 |
| Revenue Growth, % | 0 | 2.14 | -4.11 | 80.05 | 28.13 | 26.55 | 26.55 | 26.55 | 26.55 | 26.55 |
| EBITDA | 1,063.0 | -87.6 | -1,197.5 | 3,276.5 | 3,010.9 | 1,684.3 | 2,131.6 | 2,697.6 | 3,413.8 | 4,320.3 |
| EBITDA, % | 20.62 | -1.66 | -23.72 | 36.04 | 25.85 | 11.43 | 11.43 | 11.43 | 11.43 | 11.43 |
| Depreciation | 16.7 | -21.0 | -27.0 | 134.8 | -76.1 | 6.5 | 8.2 | 10.4 | 13.1 | 16.6 |
| Depreciation, % | 0.32302 | -0.39862 | -0.53375 | 1.48 | -0.65312 | 0.04395405 | 0.04395405 | 0.04395405 | 0.04395405 | 0.04395405 |
| EBIT | 1,046.4 | -66.6 | -1,170.5 | 3,141.8 | 3,086.9 | 1,677.9 | 2,123.4 | 2,687.2 | 3,400.7 | 4,303.7 |
| EBIT, % | 20.3 | -1.26 | -23.18 | 34.56 | 26.5 | 11.38 | 11.38 | 11.38 | 11.38 | 11.38 |
| Total Cash | 6,730.5 | 7,157.4 | 5,863.6 | 6,481.6 | 6,208.3 | 12,517.8 | 15,841.6 | 20,048.0 | 25,371.2 | 32,108.0 |
| Total Cash, percent | .0 | .0 | .0 | .0 | .0 | .0 | .0 | .0 | .0 | .0 |
| Account Receivables | 6,388.9 | 8,430.7 | 10,200.9 | 13,247.2 | 11,863.3 | 14,740.9 | 18,655.0 | 23,608.4 | 29,877.0 | 37,810.1 |
| Account Receivables, % | 123.93 | 160.11 | 202.03 | 145.72 | 101.85 | 100 | 100 | 100 | 100 | 100 |
| Inventories | .0 | -11,746.6 | -16,057.5 | .0 | .0 | -5,896.4 | -7,462.0 | -9,443.4 | -11,950.8 | -15,124.1 |
| Inventories, % | 0 | -223.09 | -318.02 | 0 | 0 | -40 | -40 | -40 | -40 | -40 |
| Accounts Payable | 3,488.4 | 3,861.0 | 3,928.3 | 3,186.2 | 2,804.3 | 8,193.5 | 10,369.1 | 13,122.4 | 16,606.7 | 21,016.2 |
| Accounts Payable, % | 67.67 | 73.33 | 77.8 | 35.05 | 24.08 | 55.58 | 55.58 | 55.58 | 55.58 | 55.58 |
| Capital Expenditure | 2,304.7 | 816.3 | -481.3 | .0 | .0 | -281.0 | -355.7 | -450.1 | -569.6 | -720.8 |
| Capital Expenditure, % | 44.71 | 15.5 | -9.53 | 0 | 0 | -1.91 | -1.91 | -1.91 | -1.91 | -1.91 |
| Tax Rate, % | 37.51 | 37.51 | 37.51 | 37.51 | 37.51 | 37.51 | 37.51 | 37.51 | 37.51 | 37.51 |
| EBITAT | 801.0 | -23.4 | -1,019.1 | 2,551.5 | 1,929.0 | 1,149.4 | 1,454.6 | 1,840.8 | 2,329.5 | 2,948.1 |
| Depreciation | ||||||||||
| Changes in Account Receivables | ||||||||||
| Changes in Inventories | ||||||||||
| Changes in Accounts Payable | ||||||||||
| Capital Expenditure | ||||||||||
| UFCF | 221.8 | 10,849.4 | 1,080.5 | -17,159.6 | 2,854.9 | 9,282.7 | 934.2 | 1,182.3 | 1,496.2 | 1,893.5 |
| WACC, % | 4.85 | 4.6 | 4.91 | 4.88 | 4.76 | 4.8 | 4.8 | 4.8 | 4.8 | 4.8 |
| PV UFCF | ||||||||||
| SUM PV UFCF | 13,473.4 | |||||||||
| Long Term Growth Rate, % | 2.00 | |||||||||
| Free cash flow (T + 1) | 1,931 | |||||||||
| Terminal Value | 68,958 | |||||||||
| Present Terminal Value | 54,546 | |||||||||
| Enterprise Value | 68,019 | |||||||||
| Net Debt | 210 | |||||||||
| Equity Value | 67,809 | |||||||||
| Diluted Shares Outstanding, MM | 51 | |||||||||
| Equity Value Per Share | 1,320.81 |
What You Will Get
- Real RenaissanceRe Data: Preloaded financials – from revenue to EBIT – based on actual and projected figures.
- Full Customization: Adjust all critical parameters (yellow cells) like WACC, growth %, and tax rates.
- Instant Valuation Updates: Automatic recalculations to analyze the impact of changes on RenaissanceRe’s fair value.
- Versatile Excel Template: Tailored for quick edits, scenario testing, and detailed projections.
- Time-Saving and Accurate: Skip building models from scratch while maintaining precision and flexibility.
Key Features
- Comprehensive DCF Calculator: Features detailed unlevered and levered DCF valuation models tailored for RenaissanceRe Holdings Ltd. (RNR).
- WACC Calculator: Comes with a pre-built Weighted Average Cost of Capital sheet that allows for customizable inputs.
- Adjustable Forecast Assumptions: Easily modify growth rates, capital expenditures, and discount rates to fit your analysis.
- Integrated Financial Ratios: Evaluate profitability, leverage, and efficiency ratios specific to RenaissanceRe Holdings Ltd. (RNR).
- Interactive Dashboard and Charts: Visual representations summarize essential valuation metrics for straightforward analysis.
How It Works
- 1. Access the Template: Download and open the Excel file featuring RenaissanceRe Holdings Ltd. (RNR)'s preloaded data.
- 2. Modify Assumptions: Adjust key inputs such as growth rates, WACC, and capital expenditures.
- 3. View Results in Real-Time: The DCF model automatically calculates the intrinsic value and NPV.
- 4. Explore Scenarios: Analyze various forecasts to evaluate different valuation results.
- 5. Present with Assurance: Deliver professional valuation insights to reinforce your decision-making.
Why Choose This Calculator?
- Accurate Data: Real RenaissanceRe Holdings Ltd. (RNR) financials ensure reliable valuation results.
- Customizable: Adjust key parameters like growth rates, WACC, and tax rates to match your projections.
- Time-Saving: Pre-built calculations eliminate the need to start from scratch.
- Professional-Grade Tool: Designed for investors, analysts, and consultants.
- User-Friendly: Intuitive layout and step-by-step instructions make it easy for all users.
Who Should Use RenaissanceRe Holdings Ltd. (RNR)?
- Investors: Gain insights into the reinsurance market with a robust analysis tool.
- Financial Analysts: Streamline your workflow with customized financial models tailored for RNR.
- Consultants: Effortlessly modify reports for client needs using this comprehensive template.
- Insurance Professionals: Enhance your knowledge of underwriting and risk management practices with real case studies.
- Students and Educators: Utilize it as a hands-on resource for learning about the insurance and reinsurance sectors.
What the Template Contains
- Pre-Filled Data: Includes RenaissanceRe's historical financials and forecasts.
- Discounted Cash Flow Model: Editable DCF valuation model with automatic calculations.
- Weighted Average Cost of Capital (WACC): A dedicated sheet for calculating WACC based on custom inputs.
- Key Financial Ratios: Analyze RenaissanceRe's profitability, efficiency, and leverage.
- Customizable Inputs: Edit revenue growth, margins, and tax rates with ease.
- Clear Dashboard: Charts and tables summarizing key valuation results.
Disclaimer
All information, articles, and product details provided on this website are for general informational and educational purposes only. We do not claim any ownership over, nor do we intend to infringe upon, any trademarks, copyrights, logos, brand names, or other intellectual property mentioned or depicted on this site. Such intellectual property remains the property of its respective owners, and any references here are made solely for identification or informational purposes, without implying any affiliation, endorsement, or partnership.
We make no representations or warranties, express or implied, regarding the accuracy, completeness, or suitability of any content or products presented. Nothing on this website should be construed as legal, tax, investment, financial, medical, or other professional advice. In addition, no part of this site—including articles or product references—constitutes a solicitation, recommendation, endorsement, advertisement, or offer to buy or sell any securities, franchises, or other financial instruments, particularly in jurisdictions where such activity would be unlawful.
All content is of a general nature and may not address the specific circumstances of any individual or entity. It is not a substitute for professional advice or services. Any actions you take based on the information provided here are strictly at your own risk. You accept full responsibility for any decisions or outcomes arising from your use of this website and agree to release us from any liability in connection with your use of, or reliance upon, the content or products found herein.