
|
Range Resources Corporation (RRC) DCF تقييم |
Fully Editable: Tailor To Your Needs In Excel Or Sheets
Professional Design: Trusted, Industry-Standard Templates
Investor-Approved Valuation Models
MAC/PC Compatible, Fully Unlocked
No Expertise Is Needed; Easy To Follow
Range Resources Corporation (RRC) Bundle
عزز استراتيجياتك الاستثمارية باستخدام حاسبة Range Resources Corporation (RRC) DCF! استكشف البيانات المالية الحقيقية لموارد المدى، وضبط توقعات النمو والنفقات، ولاحظ على الفور كيف تؤثر هذه التغييرات على القيمة الجوهرية (RRC).
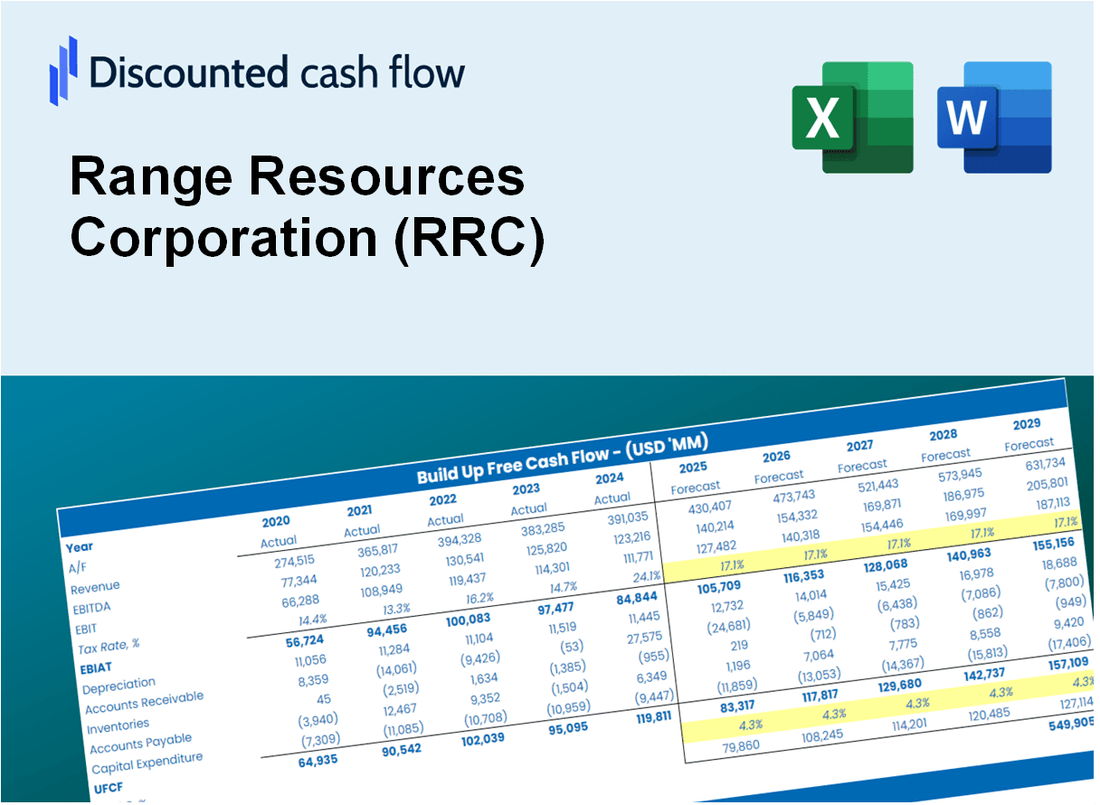
Discounted Cash Flow (DCF) - (USD MM)
| Year | AY1 2020 |
AY2 2021 |
AY3 2022 |
AY4 2023 |
AY5 2024 |
FY1 2025 |
FY2 2026 |
FY3 2027 |
FY4 2028 |
FY5 2029 |
|---|---|---|---|---|---|---|---|---|---|---|
| Revenue | 1,781.0 | 3,580.4 | 5,335.3 | 2,553.3 | 2,360.0 | 2,886.9 | 3,531.5 | 4,319.9 | 5,284.3 | 6,464.0 |
| Revenue Growth, % | 0 | 101.04 | 49.01 | -52.14 | -7.57 | 22.33 | 22.33 | 22.33 | 22.33 | 22.33 |
| EBITDA | -130.1 | 1,001.1 | 1,961.0 | 1,620.9 | 736.1 | 878.1 | 1,074.2 | 1,314.0 | 1,607.3 | 1,966.2 |
| EBITDA, % | -7.31 | 27.96 | 36.76 | 63.48 | 31.19 | 30.42 | 30.42 | 30.42 | 30.42 | 30.42 |
| Depreciation | 414.6 | 371.8 | 382.0 | 396.5 | 366.8 | 415.1 | 507.8 | 621.1 | 759.8 | 929.4 |
| Depreciation, % | 23.28 | 10.38 | 7.16 | 15.53 | 15.54 | 14.38 | 14.38 | 14.38 | 14.38 | 14.38 |
| EBIT | -544.7 | 629.4 | 1,579.0 | 1,224.3 | 369.4 | 463.0 | 566.4 | 692.9 | 847.5 | 1,036.7 |
| EBIT, % | -30.58 | 17.58 | 29.59 | 47.95 | 15.65 | 16.04 | 16.04 | 16.04 | 16.04 | 16.04 |
| Total Cash | .5 | 214.4 | .2 | 212.0 | 304.5 | 157.2 | 192.3 | 235.2 | 287.7 | 351.9 |
| Total Cash, percent | .0 | .0 | .0 | .0 | .0 | .0 | .0 | .0 | .0 | .0 |
| Account Receivables | 252.6 | 501.3 | 505.6 | 282.7 | 302.2 | 355.3 | 434.6 | 531.7 | 650.4 | 795.6 |
| Account Receivables, % | 14.19 | 14 | 9.48 | 11.07 | 12.81 | 12.31 | 12.31 | 12.31 | 12.31 | 12.31 |
| Inventories | .0 | -35.2 | .0 | .0 | .0 | -5.7 | -7.0 | -8.5 | -10.4 | -12.7 |
| Inventories, % | 0 | -0.98418 | 0 | 0 | 0 | -0.19684 | -0.19684 | -0.19684 | -0.19684 | -0.19684 |
| Accounts Payable | 132.4 | 178.4 | 206.7 | 110.1 | 133.1 | 151.6 | 185.4 | 226.8 | 277.4 | 339.3 |
| Accounts Payable, % | 7.44 | 4.98 | 3.87 | 4.31 | 5.64 | 5.25 | 5.25 | 5.25 | 5.25 | 5.25 |
| Capital Expenditure | -432.4 | -417.4 | -487.4 | -606.2 | -628.6 | -551.1 | -674.2 | -824.7 | -1,008.8 | -1,234.0 |
| Capital Expenditure, % | -24.28 | -11.66 | -9.14 | -23.74 | -26.63 | -19.09 | -19.09 | -19.09 | -19.09 | -19.09 |
| Tax Rate, % | -5.76 | -5.76 | -5.76 | -5.76 | -5.76 | -5.76 | -5.76 | -5.76 | -5.76 | -5.76 |
| EBITAT | -525.8 | 627.7 | 1,289.7 | 952.7 | 390.6 | 422.1 | 516.3 | 631.5 | 772.5 | 945.0 |
| Depreciation | ||||||||||
| Changes in Account Receivables | ||||||||||
| Changes in Inventories | ||||||||||
| Changes in Accounts Payable | ||||||||||
| Capital Expenditure | ||||||||||
| UFCF | -663.9 | 414.6 | 1,173.1 | 869.2 | 132.3 | 257.0 | 305.7 | 373.9 | 457.4 | 559.5 |
| WACC, % | 6.16 | 6.2 | 6 | 5.95 | 6.2 | 6.1 | 6.1 | 6.1 | 6.1 | 6.1 |
| PV UFCF | ||||||||||
| SUM PV UFCF | 1,603.7 | |||||||||
| Long Term Growth Rate, % | 0.50 | |||||||||
| Free cash flow (T + 1) | 562 | |||||||||
| Terminal Value | 10,035 | |||||||||
| Present Terminal Value | 7,463 | |||||||||
| Enterprise Value | 9,066 | |||||||||
| Net Debt | 1,516 | |||||||||
| Equity Value | 7,550 | |||||||||
| Diluted Shares Outstanding, MM | 243 | |||||||||
| Equity Value Per Share | 31.10 |
What You Will Get
- Real Range Resources Data: Preloaded financials – from revenue to EBIT – based on actual and projected figures.
- Full Customization: Adjust all critical parameters (yellow cells) like WACC, growth %, and tax rates.
- Instant Valuation Updates: Automatic recalculations to analyze the impact of changes on Range Resources’ fair value.
- Versatile Excel Template: Tailored for quick edits, scenario testing, and detailed projections.
- Time-Saving and Accurate: Skip building models from scratch while maintaining precision and flexibility.
Key Features
- Customizable Exploration Metrics: Adjust essential parameters such as production rates, cost per barrel, and reserve estimates.
- Real-Time Asset Valuation: Instantly computes asset values, cash flows, and other financial metrics.
- Industry-Leading Precision: Leverages Range Resources Corporation's (RRC) actual operational data for accurate valuation results.
- Streamlined Scenario Planning: Easily evaluate various market conditions and their potential impacts on performance.
- Efficiency Booster: Avoid the complexity of developing detailed financial models from the ground up.
How It Works
- Step 1: Download the Excel file.
- Step 2: Review pre-entered Range Resources Corporation (RRC) data (historical and projected).
- Step 3: Adjust key assumptions (yellow cells) based on your analysis.
- Step 4: View automatic recalculations for Range Resources Corporation’s intrinsic value.
- Step 5: Use the outputs for investment decisions or reporting.
Why Choose Range Resources Corporation (RRC)?
- Proven Track Record: Established history in the energy sector with consistent performance.
- Resource Rich: Access to substantial natural gas reserves enhances growth potential.
- Innovative Practices: Commitment to advanced technologies for efficient resource extraction.
- Strong Financial Health: Robust financial metrics support sustainable operations and investments.
- Expert Team: Led by industry veterans dedicated to maximizing shareholder value.
Who Should Use This Product?
- Investors: Accurately assess Range Resources Corporation’s (RRC) intrinsic value prior to making investment choices.
- CFOs: Utilize a high-quality DCF model for financial analysis and reporting related to (RRC).
- Consultants: Effortlessly modify the template for client valuation reports involving (RRC).
- Entrepreneurs: Acquire knowledge on financial modeling techniques employed by leading energy companies like (RRC).
- Educators: Implement it as an educational resource to illustrate valuation strategies in the energy sector.
What the Template Contains
- Historical Data: Includes Range Resources Corporation's (RRC) past financials and baseline forecasts.
- DCF and Levered DCF Models: Detailed templates to calculate Range Resources Corporation's (RRC) intrinsic value.
- WACC Sheet: Pre-built calculations for Weighted Average Cost of Capital.
- Editable Inputs: Modify key drivers like production growth rates, EBITDA %, and CAPEX assumptions.
- Quarterly and Annual Statements: A complete breakdown of Range Resources Corporation's (RRC) financials.
- Interactive Dashboard: Visualize valuation results and projections dynamically.
Disclaimer
All information, articles, and product details provided on this website are for general informational and educational purposes only. We do not claim any ownership over, nor do we intend to infringe upon, any trademarks, copyrights, logos, brand names, or other intellectual property mentioned or depicted on this site. Such intellectual property remains the property of its respective owners, and any references here are made solely for identification or informational purposes, without implying any affiliation, endorsement, or partnership.
We make no representations or warranties, express or implied, regarding the accuracy, completeness, or suitability of any content or products presented. Nothing on this website should be construed as legal, tax, investment, financial, medical, or other professional advice. In addition, no part of this site—including articles or product references—constitutes a solicitation, recommendation, endorsement, advertisement, or offer to buy or sell any securities, franchises, or other financial instruments, particularly in jurisdictions where such activity would be unlawful.
All content is of a general nature and may not address the specific circumstances of any individual or entity. It is not a substitute for professional advice or services. Any actions you take based on the information provided here are strictly at your own risk. You accept full responsibility for any decisions or outcomes arising from your use of this website and agree to release us from any liability in connection with your use of, or reliance upon, the content or products found herein.