
|
اعتماد الصلب & شركة الألومنيوم (RS) تقييم DCF |
Fully Editable: Tailor To Your Needs In Excel Or Sheets
Professional Design: Trusted, Industry-Standard Templates
Investor-Approved Valuation Models
MAC/PC Compatible, Fully Unlocked
No Expertise Is Needed; Easy To Follow
Reliance Steel & Aluminum Co. (RS) Bundle
عزز اختياراتك الاستثمارية مع Reliance Steel & شركة الألومنيوم (RS) حاسبة DCF! الاستفادة & شركة الألومنيوم (روبية) في الوقت الفعلي.
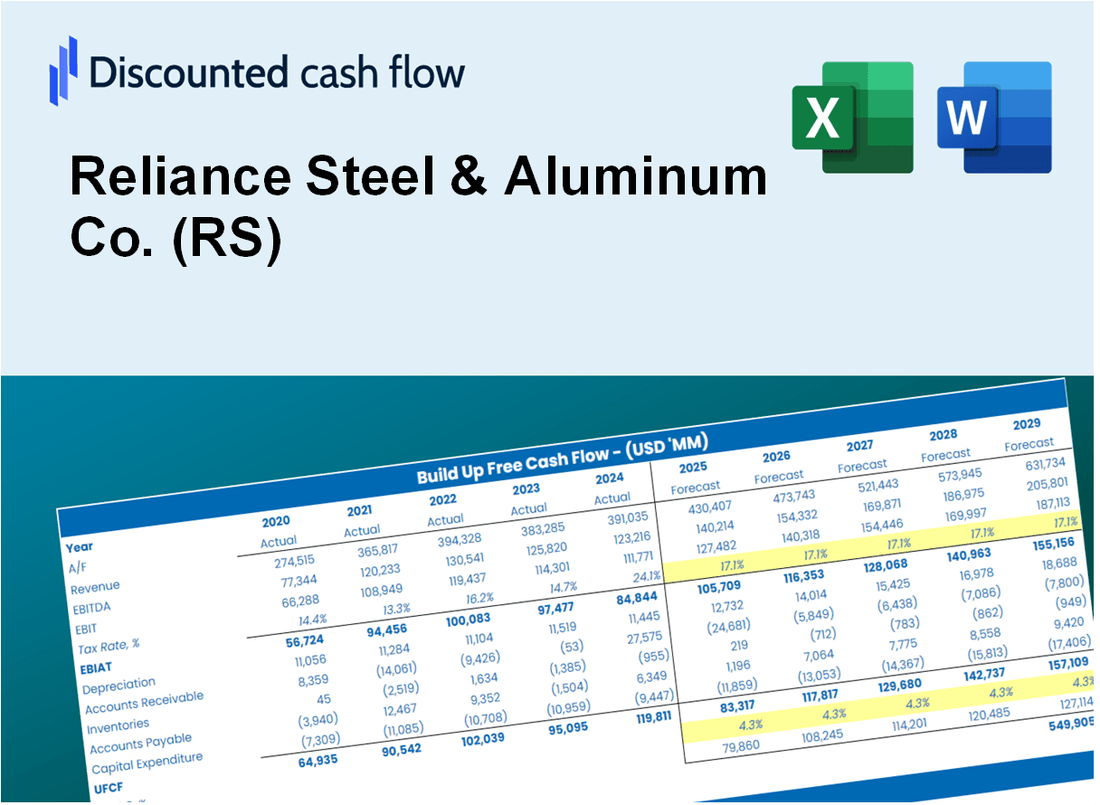
Discounted Cash Flow (DCF) - (USD MM)
| Year | AY1 2020 |
AY2 2021 |
AY3 2022 |
AY4 2023 |
AY5 2024 |
FY1 2025 |
FY2 2026 |
FY3 2027 |
FY4 2028 |
FY5 2029 |
|---|---|---|---|---|---|---|---|---|---|---|
| Revenue | 8,811.9 | 14,093.3 | 17,025.0 | 14,805.9 | 13,835.0 | 15,949.9 | 18,388.0 | 21,198.8 | 24,439.3 | 28,175.2 |
| Revenue Growth, % | 0 | 59.93 | 20.8 | -13.03 | -6.56 | 15.29 | 15.29 | 15.29 | 15.29 | 15.29 |
| EBITDA | 847.8 | 2,261.5 | 2,732.9 | 2,026.2 | 1,448.9 | 2,101.5 | 2,422.7 | 2,793.1 | 3,220.0 | 3,712.2 |
| EBITDA, % | 9.62 | 16.05 | 16.05 | 13.69 | 10.47 | 13.18 | 13.18 | 13.18 | 13.18 | 13.18 |
| Depreciation | 227.3 | 230.2 | 240.2 | 245.4 | 268.7 | 294.2 | 339.2 | 391.0 | 450.8 | 519.7 |
| Depreciation, % | 2.58 | 1.63 | 1.41 | 1.66 | 1.94 | 1.84 | 1.84 | 1.84 | 1.84 | 1.84 |
| EBIT | 620.5 | 2,031.3 | 2,492.7 | 1,780.8 | 1,180.2 | 1,807.3 | 2,083.5 | 2,402.0 | 2,769.2 | 3,192.5 |
| EBIT, % | 7.04 | 14.41 | 14.64 | 12.03 | 8.53 | 11.33 | 11.33 | 11.33 | 11.33 | 11.33 |
| Total Cash | 683.5 | 300.5 | 1,173.4 | 1,080.2 | 318.1 | 841.4 | 970.0 | 1,118.3 | 1,289.2 | 1,486.3 |
| Total Cash, percent | .0 | .0 | .0 | .0 | .0 | .0 | .0 | .0 | .0 | .0 |
| Account Receivables | 928.4 | 1,683.0 | 1,602.3 | 1,508.0 | 1,402.4 | 1,665.5 | 1,920.1 | 2,213.6 | 2,552.0 | 2,942.1 |
| Account Receivables, % | 10.54 | 11.94 | 9.41 | 10.19 | 10.14 | 10.44 | 10.44 | 10.44 | 10.44 | 10.44 |
| Inventories | 1,420.4 | 2,065.0 | 1,995.3 | 2,043.2 | 2,026.8 | 2,263.0 | 2,608.9 | 3,007.7 | 3,467.5 | 3,997.6 |
| Inventories, % | 16.12 | 14.65 | 11.72 | 13.8 | 14.65 | 14.19 | 14.19 | 14.19 | 14.19 | 14.19 |
| Accounts Payable | 259.3 | 453.9 | 412.4 | 410.3 | 361.9 | 445.7 | 513.9 | 592.4 | 683.0 | 787.4 |
| Accounts Payable, % | 2.94 | 3.22 | 2.42 | 2.77 | 2.62 | 2.79 | 2.79 | 2.79 | 2.79 | 2.79 |
| Capital Expenditure | -172.0 | -236.6 | -341.8 | -468.8 | -430.6 | -380.2 | -438.3 | -505.3 | -582.5 | -671.5 |
| Capital Expenditure, % | -1.95 | -1.68 | -2.01 | -3.17 | -3.11 | -2.38 | -2.38 | -2.38 | -2.38 | -2.38 |
| Tax Rate, % | 23.22 | 23.22 | 23.22 | 23.22 | 23.22 | 23.22 | 23.22 | 23.22 | 23.22 | 23.22 |
| EBITAT | 478.9 | 1,524.2 | 1,887.3 | 1,366.7 | 906.1 | 1,378.8 | 1,589.5 | 1,832.5 | 2,112.7 | 2,435.6 |
| Depreciation | ||||||||||
| Changes in Account Receivables | ||||||||||
| Changes in Inventories | ||||||||||
| Changes in Accounts Payable | ||||||||||
| Capital Expenditure | ||||||||||
| UFCF | -1,555.3 | 313.2 | 1,894.6 | 1,187.6 | 817.8 | 877.4 | 958.1 | 1,104.6 | 1,273.4 | 1,468.1 |
| WACC, % | 7.4 | 7.39 | 7.4 | 7.4 | 7.4 | 7.4 | 7.4 | 7.4 | 7.4 | 7.4 |
| PV UFCF | ||||||||||
| SUM PV UFCF | 4,524.0 | |||||||||
| Long Term Growth Rate, % | 2.00 | |||||||||
| Free cash flow (T + 1) | 1,497 | |||||||||
| Terminal Value | 27,746 | |||||||||
| Present Terminal Value | 19,420 | |||||||||
| Enterprise Value | 23,944 | |||||||||
| Net Debt | 1,100 | |||||||||
| Equity Value | 22,844 | |||||||||
| Diluted Shares Outstanding, MM | 56 | |||||||||
| Equity Value Per Share | 406.14 |
What You Will Get
- Real RS Financials: Access to historical and projected data for precise valuation.
- Customizable Inputs: Adjust WACC, tax rates, revenue growth, and capital expenditures as needed.
- Dynamic Calculations: Intrinsic value and NPV are computed automatically.
- Scenario Analysis: Evaluate various scenarios to assess Reliance Steel & Aluminum Co.'s future performance.
- User-Friendly Design: Designed for industry professionals while remaining easy to use for newcomers.
Key Features
- 🔍 Real-Life RS Financials: Pre-filled historical and projected data for Reliance Steel & Aluminum Co. (RS).
- ✏️ Fully Customizable Inputs: Adjust all critical parameters (yellow cells) like WACC, growth %, and tax rates.
- 📊 Professional DCF Valuation: Built-in formulas calculate Reliance Steel & Aluminum’s intrinsic value using the Discounted Cash Flow method.
- ⚡ Instant Results: Visualize Reliance Steel & Aluminum’s valuation instantly after making changes.
- Scenario Analysis: Test and compare outcomes for various financial assumptions side-by-side.
How It Works
- 1. Open the Template: Download and access the Excel file featuring Reliance Steel & Aluminum Co.'s (RS) preloaded data.
- 2. Edit Assumptions: Adjust key inputs such as growth rates, WACC, and capital expenditures specific to Reliance Steel & Aluminum Co. (RS).
- 3. View Results Instantly: The DCF model automatically calculates the intrinsic value and NPV for Reliance Steel & Aluminum Co. (RS).
- 4. Test Scenarios: Evaluate various forecasts to explore different valuation outcomes for Reliance Steel & Aluminum Co. (RS).
- 5. Use with Confidence: Present well-researched valuation insights to inform your decisions regarding Reliance Steel & Aluminum Co. (RS).
Why Choose This Calculator for Reliance Steel & Aluminum Co. (RS)?
- User-Friendly Interface: Tailored for both novices and seasoned professionals.
- Customizable Inputs: Adjust variables effortlessly to suit your financial analysis.
- Real-Time Valuation: Watch as Reliance Steel & Aluminum Co. (RS)'s valuation updates instantly with your changes.
- Preloaded Data: Comes equipped with Reliance Steel & Aluminum Co. (RS)'s latest financial metrics for swift evaluation.
- Relied Upon by Experts: A go-to tool for investors and analysts making critical decisions.
Who Should Use Reliance Steel & Aluminum Co. (RS)?
- Engineering Students: Understand material properties and their applications in real-world projects.
- Researchers: Utilize industry data to support studies on metal fabrication and distribution.
- Manufacturers: Evaluate supply chain options and pricing strategies for steel and aluminum products.
- Investors: Analyze market trends and assess investment opportunities in the metals sector.
- Small Business Owners: Learn how to navigate purchasing and inventory management in the metal industry.
What the Template Contains
- Pre-Filled Data: Includes Reliance Steel & Aluminum Co.'s (RS) historical financials and forecasts.
- Discounted Cash Flow Model: Editable DCF valuation model with automatic calculations.
- Weighted Average Cost of Capital (WACC): A dedicated sheet for calculating WACC based on custom inputs.
- Key Financial Ratios: Analyze Reliance Steel & Aluminum Co.'s (RS) profitability, efficiency, and leverage.
- Customizable Inputs: Edit revenue growth, margins, and tax rates with ease.
- Clear Dashboard: Charts and tables summarizing key valuation results.
Disclaimer
All information, articles, and product details provided on this website are for general informational and educational purposes only. We do not claim any ownership over, nor do we intend to infringe upon, any trademarks, copyrights, logos, brand names, or other intellectual property mentioned or depicted on this site. Such intellectual property remains the property of its respective owners, and any references here are made solely for identification or informational purposes, without implying any affiliation, endorsement, or partnership.
We make no representations or warranties, express or implied, regarding the accuracy, completeness, or suitability of any content or products presented. Nothing on this website should be construed as legal, tax, investment, financial, medical, or other professional advice. In addition, no part of this site—including articles or product references—constitutes a solicitation, recommendation, endorsement, advertisement, or offer to buy or sell any securities, franchises, or other financial instruments, particularly in jurisdictions where such activity would be unlawful.
All content is of a general nature and may not address the specific circumstances of any individual or entity. It is not a substitute for professional advice or services. Any actions you take based on the information provided here are strictly at your own risk. You accept full responsibility for any decisions or outcomes arising from your use of this website and agree to release us from any liability in connection with your use of, or reliance upon, the content or products found herein.