
|
Respublic Services ، Inc. (RSG) تقييم DCF |
Fully Editable: Tailor To Your Needs In Excel Or Sheets
Professional Design: Trusted, Industry-Standard Templates
Investor-Approved Valuation Models
MAC/PC Compatible, Fully Unlocked
No Expertise Is Needed; Easy To Follow
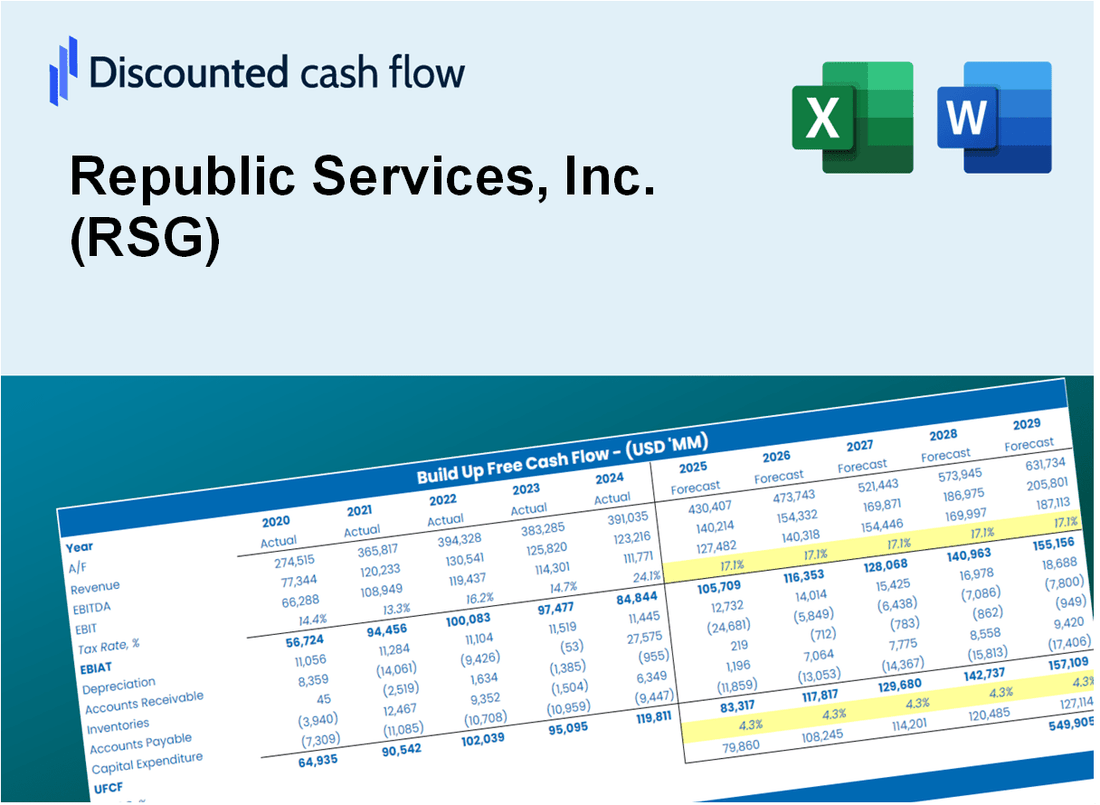
Republic Services, Inc. (RSG) Bundle
هل تبحث عن تقييم القيمة الجوهرية لشركة Republic Services، Inc. ؟ تدمج حاسبة DCF (RSG) الخاصة بنا بيانات العالم الحقيقي مع ميزات التخصيص الشاملة، مما يتيح لك تحسين توقعاتك وتعزيز خيارات الاستثمار الخاصة بك.
Discounted Cash Flow (DCF) - (USD MM)
| Year | AY1 2020 |
AY2 2021 |
AY3 2022 |
AY4 2023 |
AY5 2024 |
FY1 2025 |
FY2 2026 |
FY3 2027 |
FY4 2028 |
FY5 2029 |
|---|---|---|---|---|---|---|---|---|---|---|
| Revenue | 10,153.6 | 11,295.0 | 13,511.3 | 14,964.5 | 16,032.0 | 17,986.0 | 20,178.1 | 22,637.5 | 25,396.5 | 28,491.9 |
| Revenue Growth, % | 0 | 11.24 | 19.62 | 10.76 | 7.13 | 12.19 | 12.19 | 12.19 | 12.19 | 12.19 |
| EBITDA | 2,653.1 | 3,146.9 | 3,659.5 | 4,320.5 | 4,766.0 | 5,024.4 | 5,636.8 | 6,323.8 | 7,094.5 | 7,959.2 |
| EBITDA, % | 26.13 | 27.86 | 27.08 | 28.87 | 29.73 | 27.94 | 27.94 | 27.94 | 27.94 | 27.94 |
| Depreciation | 1,158.8 | 1,268.2 | 1,441.2 | 1,599.3 | 1,784.0 | 1,982.9 | 2,224.5 | 2,495.7 | 2,799.8 | 3,141.1 |
| Depreciation, % | 11.41 | 11.23 | 10.67 | 10.69 | 11.13 | 11.02 | 11.02 | 11.02 | 11.02 | 11.02 |
| EBIT | 1,494.3 | 1,878.7 | 2,218.3 | 2,721.2 | 2,982.0 | 3,041.5 | 3,412.2 | 3,828.1 | 4,294.7 | 4,818.1 |
| EBIT, % | 14.72 | 16.63 | 16.42 | 18.18 | 18.6 | 16.91 | 16.91 | 16.91 | 16.91 | 16.91 |
| Total Cash | 38.2 | 29.0 | 143.4 | 140.0 | 74.0 | 111.2 | 124.8 | 140.0 | 157.0 | 176.2 |
| Total Cash, percent | .0 | .0 | .0 | .0 | .0 | .0 | .0 | .0 | .0 | .0 |
| Account Receivables | 1,328.3 | 1,508.4 | 1,982.9 | 1,992.0 | 2,071.0 | 2,422.4 | 2,717.7 | 3,048.9 | 3,420.5 | 3,837.4 |
| Account Receivables, % | 13.08 | 13.35 | 14.68 | 13.31 | 12.92 | 13.47 | 13.47 | 13.47 | 13.47 | 13.47 |
| Inventories | 59.1 | 72.2 | 96.6 | 98.0 | 98.0 | 115.2 | 129.2 | 145.0 | 162.7 | 182.5 |
| Inventories, % | 0.58206 | 0.63922 | 0.71496 | 0.65488 | 0.61128 | 0.64048 | 0.64048 | 0.64048 | 0.64048 | 0.64048 |
| Accounts Payable | 779.0 | 910.0 | 1,221.8 | 1,412.0 | 1,345.0 | 1,532.3 | 1,719.0 | 1,928.6 | 2,163.6 | 2,427.3 |
| Accounts Payable, % | 7.67 | 8.06 | 9.04 | 9.44 | 8.39 | 8.52 | 8.52 | 8.52 | 8.52 | 8.52 |
| Capital Expenditure | -1,194.6 | -1,316.3 | -1,454.0 | -1,631.1 | -1,855.0 | -2,037.8 | -2,286.2 | -2,564.9 | -2,877.5 | -3,228.2 |
| Capital Expenditure, % | -11.77 | -11.65 | -10.76 | -10.9 | -11.57 | -11.33 | -11.33 | -11.33 | -11.33 | -11.33 |
| Tax Rate, % | 16 | 16 | 16 | 16 | 16 | 16 | 16 | 16 | 16 | 16 |
| EBITAT | 1,264.8 | 1,539.1 | 1,801.8 | 2,149.4 | 2,505.0 | 2,498.8 | 2,803.4 | 3,145.0 | 3,528.4 | 3,958.4 |
| Depreciation | ||||||||||
| Changes in Account Receivables | ||||||||||
| Changes in Inventories | ||||||||||
| Changes in Accounts Payable | ||||||||||
| Capital Expenditure | ||||||||||
| UFCF | 620.6 | 1,428.8 | 1,601.9 | 2,297.3 | 2,288.0 | 2,262.5 | 2,619.1 | 2,938.4 | 3,296.5 | 3,698.3 |
| WACC, % | 5.9 | 5.88 | 5.87 | 5.86 | 5.89 | 5.88 | 5.88 | 5.88 | 5.88 | 5.88 |
| PV UFCF | ||||||||||
| SUM PV UFCF | 12,350.7 | |||||||||
| Long Term Growth Rate, % | 3.00 | |||||||||
| Free cash flow (T + 1) | 3,809 | |||||||||
| Terminal Value | 132,236 | |||||||||
| Present Terminal Value | 99,372 | |||||||||
| Enterprise Value | 111,723 | |||||||||
| Net Debt | 12,883 | |||||||||
| Equity Value | 98,840 | |||||||||
| Diluted Shares Outstanding, MM | 315 | |||||||||
| Equity Value Per Share | 313.98 |
What You Will Receive
- Customizable Excel Template: A fully adjustable Excel-based DCF Calculator featuring pre-filled real RSG financials.
- Authentic Data: Historical performance metrics and forward-looking projections (highlighted in the yellow cells).
- Flexible Forecasting: Modify forecast parameters such as revenue growth, EBITDA %, and WACC.
- Instant Calculations: Quickly observe how your inputs affect Republic Services, Inc.'s valuation.
- Professional Resource: Designed for investors, CFOs, consultants, and financial analysts.
- User-Friendly Interface: Organized for clarity and ease of navigation, complete with step-by-step guidance.
Key Features
- Comprehensive RSG Data: Pre-loaded with Republic Services’ historical performance metrics and future projections.
- Customizable Assumptions: Modify revenue growth rates, profit margins, discount rates, tax assumptions, and capital investment plans.
- Interactive Valuation Tool: Instantly refreshes Net Present Value (NPV) and intrinsic value calculations based on your customized inputs.
- Scenario Analysis: Develop various forecasting scenarios to explore different valuation possibilities.
- Intuitive User Interface: Designed for ease of use, catering to both seasoned professionals and newcomers.
How It Works
- Step 1: Download the prebuilt Excel template with Republic Services, Inc.'s (RSG) data included.
- Step 2: Explore the pre-filled sheets and familiarize yourself with the key metrics.
- Step 3: Update forecasts and assumptions in the editable yellow cells (WACC, growth, margins).
- Step 4: Instantly view recalculated results, including Republic Services, Inc.'s (RSG) intrinsic value.
- Step 5: Make informed investment decisions or generate reports using the outputs.
Why Choose This Calculator for Republic Services, Inc. (RSG)?
- All-in-One Solution: Features DCF, WACC, and financial ratio analyses tailored for Republic Services.
- Flexible Inputs: Modify the highlighted cells to explore different financial scenarios.
- In-Depth Analysis: Automatically computes the intrinsic value and Net Present Value for Republic Services.
- Preloaded Information: Includes historical and projected data for accurate analysis.
- High-Quality Standards: Perfect for financial analysts, investors, and business advisors focusing on Republic Services.
Who Should Use This Product?
- Investors: Evaluate Republic Services, Inc. (RSG)'s market position before making investment decisions.
- CFOs and Financial Analysts: Enhance valuation methodologies and assess financial forecasts.
- Startup Founders: Understand the valuation strategies of established companies like Republic Services, Inc. (RSG).
- Consultants: Provide detailed valuation analyses and reports for client engagements.
- Students and Educators: Utilize current data to learn and teach valuation principles effectively.
What the Template Contains
- Comprehensive DCF Model: Editable template featuring thorough valuation calculations.
- Real-World Data: Republic Services, Inc.'s (RSG) historical and projected financials preloaded for analysis.
- Customizable Parameters: Modify WACC, growth rates, and tax assumptions to explore various scenarios.
- Financial Statements: Complete annual and quarterly breakdowns for enhanced insights.
- Key Ratios: Integrated analysis for profitability, efficiency, and leverage metrics.
- Dashboard with Visual Outputs: Charts and tables presenting clear, actionable results.
Disclaimer
All information, articles, and product details provided on this website are for general informational and educational purposes only. We do not claim any ownership over, nor do we intend to infringe upon, any trademarks, copyrights, logos, brand names, or other intellectual property mentioned or depicted on this site. Such intellectual property remains the property of its respective owners, and any references here are made solely for identification or informational purposes, without implying any affiliation, endorsement, or partnership.
We make no representations or warranties, express or implied, regarding the accuracy, completeness, or suitability of any content or products presented. Nothing on this website should be construed as legal, tax, investment, financial, medical, or other professional advice. In addition, no part of this site—including articles or product references—constitutes a solicitation, recommendation, endorsement, advertisement, or offer to buy or sell any securities, franchises, or other financial instruments, particularly in jurisdictions where such activity would be unlawful.
All content is of a general nature and may not address the specific circumstances of any individual or entity. It is not a substitute for professional advice or services. Any actions you take based on the information provided here are strictly at your own risk. You accept full responsibility for any decisions or outcomes arising from your use of this website and agree to release us from any liability in connection with your use of, or reliance upon, the content or products found herein.