
|
تقييم Ryerson Holding Corporation (RYI) DCF |
Fully Editable: Tailor To Your Needs In Excel Or Sheets
Professional Design: Trusted, Industry-Standard Templates
Investor-Approved Valuation Models
MAC/PC Compatible, Fully Unlocked
No Expertise Is Needed; Easy To Follow
Ryerson Holding Corporation (RYI) Bundle
تبحث لتقييم القيمة الجوهرية لشركة Ryerson Holding Corporation؟ يدمج حاسبة DCF (RYI) DCF بيانات العالم الحقيقي مع خيارات تخصيص شاملة ، مما يتيح لك تحسين التوقعات وتعزيز استراتيجية الاستثمار الخاصة بك.
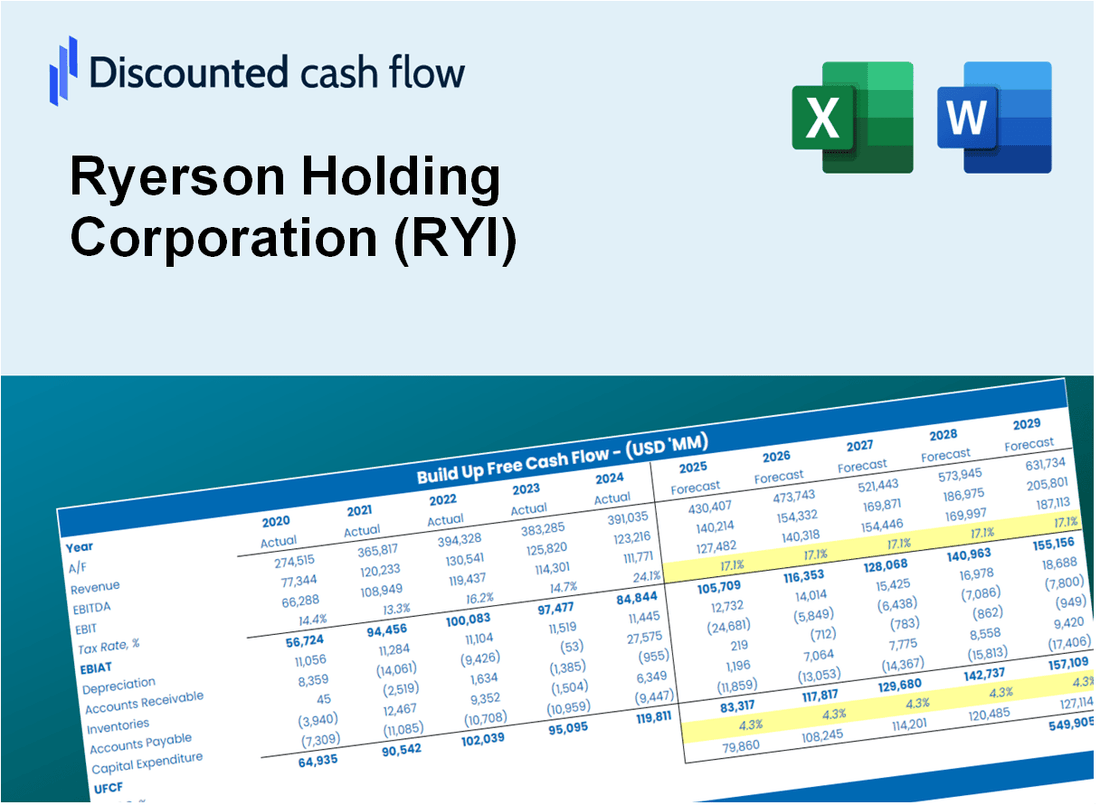
Discounted Cash Flow (DCF) - (USD MM)
| Year | AY1 2020 |
AY2 2021 |
AY3 2022 |
AY4 2023 |
AY5 2024 |
FY1 2025 |
FY2 2026 |
FY3 2027 |
FY4 2028 |
FY5 2029 |
|---|---|---|---|---|---|---|---|---|---|---|
| Revenue | 3,466.6 | 5,675.3 | 6,323.6 | 5,108.7 | 4,598.7 | 5,126.9 | 5,715.7 | 6,372.2 | 7,104.1 | 7,920.0 |
| Revenue Growth, % | 0 | 63.71 | 11.42 | -19.21 | -9.98 | 11.49 | 11.49 | 11.49 | 11.49 | 11.49 |
| EBITDA | 39.0 | 492.5 | 615.1 | 290.9 | 113.2 | 283.9 | 316.5 | 352.8 | 393.4 | 438.5 |
| EBITDA, % | 1.13 | 8.68 | 9.73 | 5.69 | 2.46 | 5.54 | 5.54 | 5.54 | 5.54 | 5.54 |
| Depreciation | 53.9 | 55.9 | 59.0 | 62.5 | 77.6 | 65.5 | 73.0 | 81.4 | 90.7 | 101.1 |
| Depreciation, % | 1.55 | 0.98497 | 0.93301 | 1.22 | 1.69 | 1.28 | 1.28 | 1.28 | 1.28 | 1.28 |
| EBIT | -14.9 | 436.6 | 556.1 | 228.4 | 35.6 | 218.4 | 243.5 | 271.5 | 302.7 | 337.4 |
| EBIT, % | -0.42982 | 7.69 | 8.79 | 4.47 | 0.77413 | 4.26 | 4.26 | 4.26 | 4.26 | 4.26 |
| Total Cash | 61.4 | 51.2 | 39.2 | 54.3 | 27.7 | 50.8 | 56.7 | 63.2 | 70.5 | 78.5 |
| Total Cash, percent | .0 | .0 | .0 | .0 | .0 | .0 | .0 | .0 | .0 | .0 |
| Account Receivables | 389.7 | 652.1 | -57.2 | 486.5 | 445.4 | 420.8 | 469.1 | 523.0 | 583.0 | 650.0 |
| Account Receivables, % | 11.24 | 11.49 | -0.90455 | 9.52 | 9.69 | 8.21 | 8.21 | 8.21 | 8.21 | 8.21 |
| Inventories | 604.5 | 832.1 | 798.5 | 782.5 | 684.6 | 768.3 | 856.6 | 954.9 | 1,064.6 | 1,186.9 |
| Inventories, % | 17.44 | 14.66 | 12.63 | 15.32 | 14.89 | 14.99 | 14.99 | 14.99 | 14.99 | 14.99 |
| Accounts Payable | 365.1 | 481.2 | 438.4 | 463.4 | 440.8 | 457.3 | 509.8 | 568.4 | 633.7 | 706.5 |
| Accounts Payable, % | 10.53 | 8.48 | 6.93 | 9.07 | 9.59 | 8.92 | 8.92 | 8.92 | 8.92 | 8.92 |
| Capital Expenditure | -26.0 | -59.3 | -105.1 | -121.9 | -99.6 | -82.1 | -91.6 | -102.1 | -113.8 | -126.9 |
| Capital Expenditure, % | -0.75001 | -1.04 | -1.66 | -2.39 | -2.17 | -1.6 | -1.6 | -1.6 | -1.6 | -1.6 |
| Tax Rate, % | -16.22 | -16.22 | -16.22 | -16.22 | -16.22 | -16.22 | -16.22 | -16.22 | -16.22 | -16.22 |
| EBITAT | -10.8 | 330.2 | 415.8 | 171.8 | 41.4 | 173.9 | 193.9 | 216.2 | 241.0 | 268.7 |
| Depreciation | ||||||||||
| Changes in Account Receivables | ||||||||||
| Changes in Inventories | ||||||||||
| Changes in Accounts Payable | ||||||||||
| Capital Expenditure | ||||||||||
| UFCF | -612.0 | -47.1 | 1,069.8 | -390.3 | 135.8 | 114.7 | 91.3 | 101.7 | 113.4 | 126.5 |
| WACC, % | 7.12 | 7.21 | 7.19 | 7.2 | 7.9 | 7.32 | 7.32 | 7.32 | 7.32 | 7.32 |
| PV UFCF | ||||||||||
| SUM PV UFCF | 442.7 | |||||||||
| Long Term Growth Rate, % | 0.50 | |||||||||
| Free cash flow (T + 1) | 127 | |||||||||
| Terminal Value | 1,863 | |||||||||
| Present Terminal Value | 1,308 | |||||||||
| Enterprise Value | 1,751 | |||||||||
| Net Debt | 823 | |||||||||
| Equity Value | 928 | |||||||||
| Diluted Shares Outstanding, MM | 33 | |||||||||
| Equity Value Per Share | 28.33 |
What You Will Get
- Real RYI Financials: Access to historical data and forecasts for precise valuation.
- Customizable Inputs: Adjust WACC, tax rates, revenue growth, and capital expenditures as needed.
- Dynamic Calculations: Intrinsic value and NPV are computed automatically.
- Scenario Analysis: Evaluate various scenarios to assess Ryerson's future performance.
- User-Friendly Design: Designed for professionals but easy to navigate for newcomers.
Key Features
- Comprehensive DCF Calculator: Offers detailed unlevered and levered DCF valuation models tailored for Ryerson Holding Corporation (RYI).
- WACC Calculator: Features a pre-constructed Weighted Average Cost of Capital sheet with customizable parameters.
- Adjustable Forecast Assumptions: Easily modify growth projections, capital expenditures, and discount rates.
- Integrated Financial Ratios: Evaluate profitability, leverage, and efficiency ratios specific to Ryerson Holding Corporation (RYI).
- Visual Dashboard and Charts: Graphical representations summarize essential valuation metrics for straightforward analysis.
How It Works
- Download: Obtain the pre-built Excel file featuring Ryerson Holding Corporation’s (RYI) financial data.
- Customize: Modify projections, such as revenue growth, EBITDA margin, and WACC.
- Update Automatically: The intrinsic value and NPV calculations refresh in real-time.
- Test Scenarios: Generate various forecasts and instantly compare results.
- Make Decisions: Leverage the valuation insights to inform your investment approach.
Why Choose Ryerson Holding Corporation (RYI)?
- Extensive Experience: Over a century of expertise in the metals industry ensures reliable service.
- Diverse Product Range: A wide selection of metals and materials to meet various needs.
- Customer-Centric Approach: Focused on delivering tailored solutions for every client.
- Innovative Technology: Utilizes advanced processes to enhance efficiency and quality.
- Industry Recognition: A trusted name in the market, known for excellence and integrity.
Who Should Use This Product?
- Investors: Accurately assess Ryerson Holding Corporation’s (RYI) fair value prior to making investment choices.
- CFOs: Utilize a professional-grade DCF model for comprehensive financial reporting and analysis.
- Consultants: Efficiently customize the template for client valuation reports.
- Entrepreneurs: Acquire insights into the financial modeling practices of leading companies.
- Educators: Employ it as a teaching resource to illustrate valuation techniques.
What the Template Contains
- Pre-Filled Data: Includes Ryerson Holding Corporation's (RYI) historical financials and forecasts.
- Discounted Cash Flow Model: Editable DCF valuation model with automatic calculations.
- Weighted Average Cost of Capital (WACC): A dedicated sheet for calculating WACC based on custom inputs.
- Key Financial Ratios: Analyze Ryerson's (RYI) profitability, efficiency, and leverage.
- Customizable Inputs: Edit revenue growth, margins, and tax rates with ease.
- Clear Dashboard: Charts and tables summarizing key valuation results.
Disclaimer
All information, articles, and product details provided on this website are for general informational and educational purposes only. We do not claim any ownership over, nor do we intend to infringe upon, any trademarks, copyrights, logos, brand names, or other intellectual property mentioned or depicted on this site. Such intellectual property remains the property of its respective owners, and any references here are made solely for identification or informational purposes, without implying any affiliation, endorsement, or partnership.
We make no representations or warranties, express or implied, regarding the accuracy, completeness, or suitability of any content or products presented. Nothing on this website should be construed as legal, tax, investment, financial, medical, or other professional advice. In addition, no part of this site—including articles or product references—constitutes a solicitation, recommendation, endorsement, advertisement, or offer to buy or sell any securities, franchises, or other financial instruments, particularly in jurisdictions where such activity would be unlawful.
All content is of a general nature and may not address the specific circumstances of any individual or entity. It is not a substitute for professional advice or services. Any actions you take based on the information provided here are strictly at your own risk. You accept full responsibility for any decisions or outcomes arising from your use of this website and agree to release us from any liability in connection with your use of, or reliance upon, the content or products found herein.