
|
شركة Air Corporation (انظر) تقييم DCF |
Fully Editable: Tailor To Your Needs In Excel Or Sheets
Professional Design: Trusted, Industry-Standard Templates
Investor-Approved Valuation Models
MAC/PC Compatible, Fully Unlocked
No Expertise Is Needed; Easy To Follow
Sealed Air Corporation (SEE) Bundle
قم بتعزيز استراتيجيات الاستثمار الخاصة بك باستخدام حاسبة DCF (SEE)! استخدم البيانات المالية الأصلية لشركة Air المختومة، واضبط توقعات النمو والنفقات، ولاحظ على الفور كيف تؤثر هذه التعديلات على القيمة الجوهرية لـ (SEE).
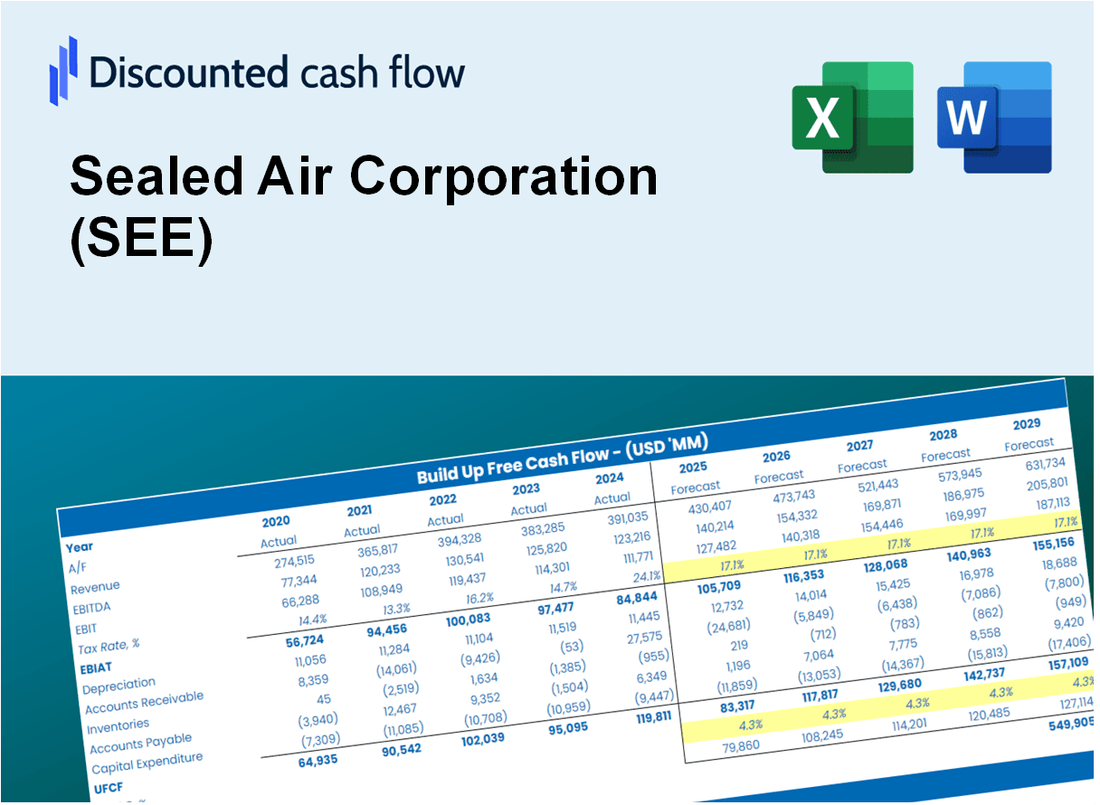
Discounted Cash Flow (DCF) - (USD MM)
| Year | AY1 2020 |
AY2 2021 |
AY3 2022 |
AY4 2023 |
AY5 2024 |
FY1 2025 |
FY2 2026 |
FY3 2027 |
FY4 2028 |
FY5 2029 |
|---|---|---|---|---|---|---|---|---|---|---|
| Revenue | 4,903.2 | 5,533.8 | 5,641.9 | 5,488.9 | 5,392.6 | 5,532.1 | 5,675.2 | 5,822.0 | 5,972.7 | 6,127.2 |
| Revenue Growth, % | 0 | 12.86 | 1.95 | -2.71 | -1.75 | 2.59 | 2.59 | 2.59 | 2.59 | 2.59 |
| EBITDA | 974.8 | 1,077.3 | 1,083.4 | 940.6 | 987.3 | 1,040.0 | 1,066.9 | 1,094.5 | 1,122.8 | 1,151.9 |
| EBITDA, % | 19.88 | 19.47 | 19.2 | 17.14 | 18.31 | 18.8 | 18.8 | 18.8 | 18.8 | 18.8 |
| Depreciation | 174.2 | 186.4 | 184.6 | 233.4 | 240.9 | 209.3 | 214.7 | 220.2 | 225.9 | 231.8 |
| Depreciation, % | 3.55 | 3.37 | 3.27 | 4.25 | 4.47 | 3.78 | 3.78 | 3.78 | 3.78 | 3.78 |
| EBIT | 800.6 | 890.9 | 898.8 | 707.2 | 746.4 | 830.7 | 852.2 | 874.3 | 896.9 | 920.1 |
| EBIT, % | 16.33 | 16.1 | 15.93 | 12.88 | 13.84 | 15.02 | 15.02 | 15.02 | 15.02 | 15.02 |
| Total Cash | 548.7 | 561.0 | 456.1 | 346.1 | 371.8 | 471.5 | 483.7 | 496.2 | 509.0 | 522.2 |
| Total Cash, percent | .0 | .0 | .0 | .0 | .0 | .0 | .0 | .0 | .0 | .0 |
| Account Receivables | 681.7 | 732.8 | 724.2 | 581.7 | 567.9 | 676.1 | 693.6 | 711.6 | 730.0 | 748.9 |
| Account Receivables, % | 13.9 | 13.24 | 12.84 | 10.6 | 10.53 | 12.22 | 12.22 | 12.22 | 12.22 | 12.22 |
| Inventories | 596.7 | 725.7 | 866.3 | 774.3 | 722.2 | 753.9 | 773.4 | 793.4 | 813.9 | 835.0 |
| Inventories, % | 12.17 | 13.11 | 15.35 | 14.11 | 13.39 | 13.63 | 13.63 | 13.63 | 13.63 | 13.63 |
| Accounts Payable | 754.2 | 959.9 | 865.6 | 764.6 | 771.0 | 844.2 | 866.0 | 888.4 | 911.4 | 935.0 |
| Accounts Payable, % | 15.38 | 17.35 | 15.34 | 13.93 | 14.3 | 15.26 | 15.26 | 15.26 | 15.26 | 15.26 |
| Capital Expenditure | -181.1 | -213.1 | -237.3 | -244.2 | -220.2 | -224.4 | -230.2 | -236.2 | -242.3 | -248.6 |
| Capital Expenditure, % | -3.69 | -3.85 | -4.21 | -4.45 | -4.08 | -4.06 | -4.06 | -4.06 | -4.06 | -4.06 |
| Tax Rate, % | 42.26 | 42.26 | 42.26 | 42.26 | 42.26 | 42.26 | 42.26 | 42.26 | 42.26 | 42.26 |
| EBITAT | 643.0 | 630.4 | 605.9 | 562.2 | 431.0 | 591.0 | 606.3 | 622.0 | 638.1 | 654.6 |
| Depreciation | ||||||||||
| Changes in Account Receivables | ||||||||||
| Changes in Inventories | ||||||||||
| Changes in Accounts Payable | ||||||||||
| Capital Expenditure | ||||||||||
| UFCF | 111.9 | 629.3 | 326.9 | 684.9 | 524.0 | 509.1 | 575.6 | 590.5 | 605.8 | 621.4 |
| WACC, % | 8.13 | 7.88 | 7.79 | 8.11 | 7.53 | 7.89 | 7.89 | 7.89 | 7.89 | 7.89 |
| PV UFCF | ||||||||||
| SUM PV UFCF | 2,308.9 | |||||||||
| Long Term Growth Rate, % | 1.00 | |||||||||
| Free cash flow (T + 1) | 628 | |||||||||
| Terminal Value | 9,113 | |||||||||
| Present Terminal Value | 6,235 | |||||||||
| Enterprise Value | 8,543 | |||||||||
| Net Debt | 4,137 | |||||||||
| Equity Value | 4,407 | |||||||||
| Diluted Shares Outstanding, MM | 146 | |||||||||
| Equity Value Per Share | 30.18 |
What You Will Get
- Real SEE Financial Data: Pre-filled with Sealed Air Corporation’s historical and projected data for precise analysis.
- Fully Editable Template: Modify key inputs like revenue growth, WACC, and EBITDA % with ease.
- Automatic Calculations: See Sealed Air Corporation’s intrinsic value update instantly based on your changes.
- Professional Valuation Tool: Designed for investors, analysts, and consultants seeking accurate DCF results.
- User-Friendly Design: Simple structure and clear instructions for all experience levels.
Key Features
- Comprehensive DCF Calculator: Features detailed unlevered and levered DCF valuation models tailored for Sealed Air Corporation (SEE).
- WACC Calculator: Pre-designed Weighted Average Cost of Capital sheet with adjustable inputs specific to Sealed Air Corporation (SEE).
- Customizable Forecast Assumptions: Easily modify growth rates, capital expenditures, and discount rates for Sealed Air Corporation (SEE).
- Integrated Financial Ratios: Evaluate profitability, leverage, and efficiency ratios specifically for Sealed Air Corporation (SEE).
- Interactive Dashboard and Charts: Visual representations summarize key valuation metrics for Sealed Air Corporation (SEE) for straightforward analysis.
How It Works
- Step 1: Download the prebuilt Excel template containing Sealed Air Corporation’s (SEE) data.
- Step 2: Review the pre-filled sheets to grasp the essential metrics.
- Step 3: Modify forecasts and assumptions in the editable yellow cells (WACC, growth, margins).
- Step 4: Instantly see recalculated results, including Sealed Air Corporation’s (SEE) intrinsic value.
- Step 5: Make well-informed investment decisions or create reports based on the outputs.
Why Choose This Calculator for Sealed Air Corporation (SEE)?
- Accurate Data: Access to real Sealed Air financials guarantees trustworthy valuation outcomes.
- Customizable: Tailor essential parameters such as growth rates, WACC, and tax rates to align with your forecasts.
- Time-Saving: Pre-configured calculations save you the hassle of starting from the ground up.
- Professional-Grade Tool: Crafted for investors, analysts, and consultants in the industry.
- User-Friendly: An intuitive design and guided instructions make it accessible for all users.
Who Should Use Sealed Air Corporation (SEE) Products?
- Investors: Gain insights and make informed decisions with our advanced packaging solutions.
- Supply Chain Managers: Enhance efficiency and reduce costs through innovative packaging technologies.
- Environmental Advocates: Explore sustainable packaging options that minimize environmental impact.
- Manufacturers: Streamline production processes with customized packaging solutions tailored to your needs.
- Educators and Students: Utilize our resources to learn about packaging science and sustainability in industry.
What the Template Contains
- Operating and Balance Sheet Data: Pre-filled Sealed Air Corporation (SEE) historical data and forecasts, including revenue, EBITDA, EBIT, and capital expenditures.
- WACC Calculation: A dedicated sheet for Weighted Average Cost of Capital (WACC), including parameters like Beta, risk-free rate, and share price.
- DCF Valuation (Unlevered and Levered): Editable Discounted Cash Flow models showing intrinsic value with detailed calculations.
- Financial Statements: Pre-loaded financial statements (annual and quarterly) to support analysis.
- Key Ratios: Includes profitability, leverage, and efficiency ratios for Sealed Air Corporation (SEE).
- Dashboard and Charts: Visual summary of valuation outputs and assumptions to analyze results easily.
Disclaimer
All information, articles, and product details provided on this website are for general informational and educational purposes only. We do not claim any ownership over, nor do we intend to infringe upon, any trademarks, copyrights, logos, brand names, or other intellectual property mentioned or depicted on this site. Such intellectual property remains the property of its respective owners, and any references here are made solely for identification or informational purposes, without implying any affiliation, endorsement, or partnership.
We make no representations or warranties, express or implied, regarding the accuracy, completeness, or suitability of any content or products presented. Nothing on this website should be construed as legal, tax, investment, financial, medical, or other professional advice. In addition, no part of this site—including articles or product references—constitutes a solicitation, recommendation, endorsement, advertisement, or offer to buy or sell any securities, franchises, or other financial instruments, particularly in jurisdictions where such activity would be unlawful.
All content is of a general nature and may not address the specific circumstances of any individual or entity. It is not a substitute for professional advice or services. Any actions you take based on the information provided here are strictly at your own risk. You accept full responsibility for any decisions or outcomes arising from your use of this website and agree to release us from any liability in connection with your use of, or reliance upon, the content or products found herein.