
|
Seneca Foods Corp (SENB) DCF تقييم |
Fully Editable: Tailor To Your Needs In Excel Or Sheets
Professional Design: Trusted, Industry-Standard Templates
Investor-Approved Valuation Models
MAC/PC Compatible, Fully Unlocked
No Expertise Is Needed; Easy To Follow
Seneca Foods Corporation (SENEB) Bundle
تقييم التوقعات المالية لشركة Seneca Foods Corp (SENB) مثل خبير! توفر لك حاسبة DCF (SENB) هذه البيانات المالية المليئة مسبقًا والمرونة الكاملة لتعديل نمو الإيرادات ، WACC ، الهوامش ، وغيرها من الافتراضات الأساسية التي تتماشى مع توقعاتك.
Benefits of Using Our Model
- Flexible Input Options: Easily adjust key assumptions (growth %, margins, WACC) to explore various scenarios.
- Ready-to-Use Financial Data: Seneca Foods Corp’s financial information pre-loaded to kickstart your analysis.
- Instant DCF Calculations: The template automatically computes Net Present Value (NPV) and intrinsic value for you.
- Customizable and Professional Design: A sleek Excel model that can be tailored to meet your valuation requirements.
- Designed for Analysts and Investors: Perfect for evaluating projections, affirming strategies, and enhancing efficiency.
Key Features
- Comprehensive DCF Calculator: Features both unlevered and levered DCF valuation models tailored for Seneca Foods Corp (SENEB).
- WACC Estimator: Ready-to-use Weighted Average Cost of Capital sheet with adjustable parameters.
- Customizable Forecast Assumptions: Easily alter growth rates, capital expenditures, and discount rates.
- Integrated Financial Ratios: Evaluate profitability, leverage, and efficiency ratios specifically for Seneca Foods Corp (SENEB).
- User-Friendly Dashboard and Charts: Visual representations of essential valuation metrics for straightforward analysis.
How It Operates
- Step 1: Download the Excel file.
- Step 2: Examine the pre-filled data for Seneca Foods Corp (SENEB), including historical and forecasted figures.
- Step 3: Modify key assumptions (highlighted in yellow) based on your insights.
- Step 4: Observe automatic recalculations reflecting Seneca Foods Corp’s (SENEB) intrinsic value.
- Step 5: Utilize the results for your investment strategies or reporting needs.
Why Choose This Calculator for Seneca Foods Corp (SENEB)?
- Precision: Utilizes accurate financial data from Seneca Foods to ensure reliability.
- Versatility: Allows users to easily adjust and explore different input scenarios.
- Efficiency: Eliminate the need to construct a discounted cash flow model from the ground up.
- High-Quality: Crafted with the expertise and standards expected at the CFO level.
- Intuitive Design: Simple to navigate, suitable for users without extensive financial modeling skills.
Who Can Benefit from This Product?
- Individual Investors: Gain insights to make informed decisions regarding buying or selling Seneca Foods Corp (SENEB) stock.
- Financial Analysts: Enhance valuation tasks with pre-built financial models tailored for the food industry.
- Consultants: Provide clients with accurate and timely valuation insights related to Seneca Foods Corp (SENEB).
- Business Owners: Learn how large food companies like Seneca Foods Corp (SENEB) are valued to inform your own business strategies.
- Finance Students: Explore valuation methodologies using real market data and practical case studies involving Seneca Foods Corp (SENEB).
Contents of the Template
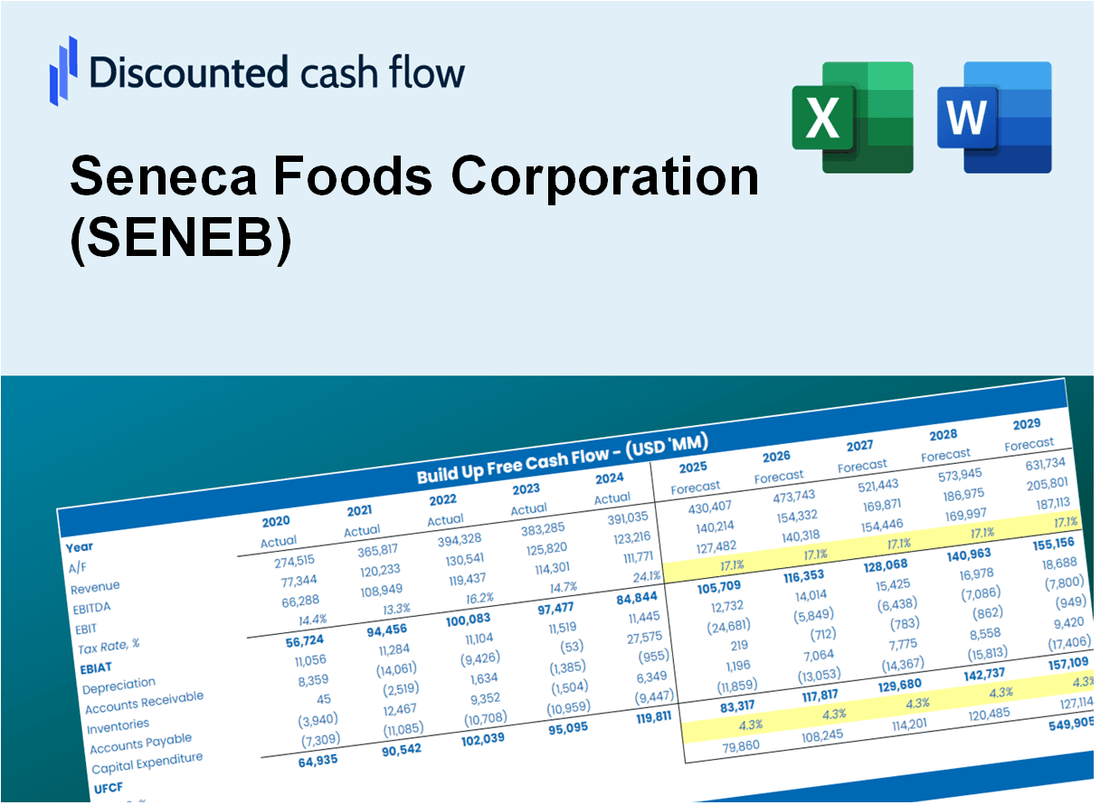
- Operating and Balance Sheet Data: Pre-filled historical data and forecasts for Seneca Foods Corp (SENEB), including revenue, EBITDA, EBIT, and capital expenditures.
- WACC Calculation: A dedicated sheet for Weighted Average Cost of Capital (WACC), featuring parameters such as Beta, risk-free rate, and share price.
- DCF Valuation (Unlevered and Levered): Editable Discounted Cash Flow models displaying intrinsic value with comprehensive calculations.
- Financial Statements: Pre-loaded annual and quarterly financial statements to aid in analysis.
- Key Ratios: Contains profitability, leverage, and efficiency ratios specific to Seneca Foods Corp (SENEB).
- Dashboard and Charts: Visual summaries of valuation outputs and assumptions for easy analysis of results.
Disclaimer
All information, articles, and product details provided on this website are for general informational and educational purposes only. We do not claim any ownership over, nor do we intend to infringe upon, any trademarks, copyrights, logos, brand names, or other intellectual property mentioned or depicted on this site. Such intellectual property remains the property of its respective owners, and any references here are made solely for identification or informational purposes, without implying any affiliation, endorsement, or partnership.
We make no representations or warranties, express or implied, regarding the accuracy, completeness, or suitability of any content or products presented. Nothing on this website should be construed as legal, tax, investment, financial, medical, or other professional advice. In addition, no part of this site—including articles or product references—constitutes a solicitation, recommendation, endorsement, advertisement, or offer to buy or sell any securities, franchises, or other financial instruments, particularly in jurisdictions where such activity would be unlawful.
All content is of a general nature and may not address the specific circumstances of any individual or entity. It is not a substitute for professional advice or services. Any actions you take based on the information provided here are strictly at your own risk. You accept full responsibility for any decisions or outcomes arising from your use of this website and agree to release us from any liability in connection with your use of, or reliance upon, the content or products found herein.