
|
Shake Shack Inc. (Shak) DCF تقييم |
Fully Editable: Tailor To Your Needs In Excel Or Sheets
Professional Design: Trusted, Industry-Standard Templates
Investor-Approved Valuation Models
MAC/PC Compatible, Fully Unlocked
No Expertise Is Needed; Easy To Follow
Shake Shack Inc. (SHAK) Bundle
عزز استراتيجياتك الاستثمارية مع Shake Shack Inc. (شاك) حاسبة DCF! انغمس في البيانات المالية الأصلية لشركة Shake Shack، واضبط توقعات النمو ونفقاته، ولاحظ على الفور كيف تؤثر هذه التعديلات على القيمة الجوهرية لشركة Shake Shack Inc. (شاك).
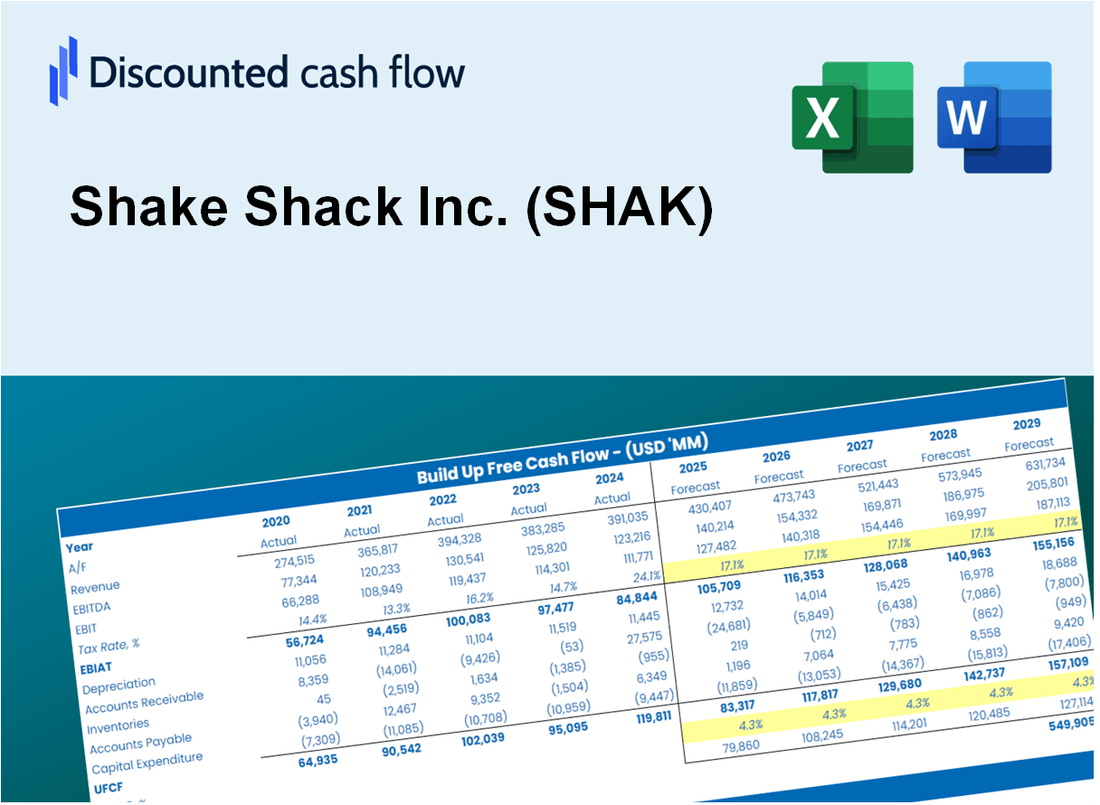
Discounted Cash Flow (DCF) - (USD MM)
| Year | AY1 2020 |
AY2 2021 |
AY3 2022 |
AY4 2023 |
AY5 2024 |
FY1 2025 |
FY2 2026 |
FY3 2027 |
FY4 2028 |
FY5 2029 |
|---|---|---|---|---|---|---|---|---|---|---|
| Revenue | 522.9 | 739.9 | 900.5 | 1,087.5 | 1,252.6 | 1,563.1 | 1,950.6 | 2,434.2 | 3,037.7 | 3,790.7 |
| Revenue Growth, % | 0 | 41.51 | 21.7 | 20.77 | 15.18 | 24.79 | 24.79 | 24.79 | 24.79 | 24.79 |
| EBITDA | 5.6 | 44.5 | 51.5 | 111.7 | 120.9 | 102.3 | 127.7 | 159.3 | 198.8 | 248.1 |
| EBITDA, % | 1.07 | 6.01 | 5.72 | 10.27 | 9.65 | 6.55 | 6.55 | 6.55 | 6.55 | 6.55 |
| Depreciation | 50.2 | 60.2 | 74.3 | 93.0 | 104.6 | 134.1 | 167.4 | 208.9 | 260.7 | 325.3 |
| Depreciation, % | 9.61 | 8.14 | 8.25 | 8.56 | 8.35 | 8.58 | 8.58 | 8.58 | 8.58 | 8.58 |
| EBIT | -44.7 | -15.8 | -22.8 | 18.7 | 16.3 | -31.8 | -39.7 | -49.6 | -61.8 | -77.2 |
| EBIT, % | -8.54 | -2.13 | -2.53 | 1.72 | 1.3 | -2.04 | -2.04 | -2.04 | -2.04 | -2.04 |
| Total Cash | 183.8 | 302.4 | 311.2 | 293.2 | 320.7 | 510.0 | 636.5 | 794.3 | 991.2 | 1,236.9 |
| Total Cash, percent | .0 | .0 | .0 | .0 | .0 | .0 | .0 | .0 | .0 | .0 |
| Account Receivables | 9.5 | 13.7 | 24.0 | 29.0 | 19.7 | 33.0 | 41.2 | 51.4 | 64.1 | 80.0 |
| Account Receivables, % | 1.81 | 1.85 | 2.67 | 2.67 | 1.57 | 2.11 | 2.11 | 2.11 | 2.11 | 2.11 |
| Inventories | 2.9 | 3.9 | 4.2 | 5.4 | 6.0 | 7.9 | 9.8 | 12.2 | 15.3 | 19.1 |
| Inventories, % | 0.55234 | 0.52035 | 0.46464 | 0.4969 | 0.48012 | 0.50287 | 0.50287 | 0.50287 | 0.50287 | 0.50287 |
| Accounts Payable | 23.5 | 19.9 | 20.4 | 22.3 | 23.6 | 41.9 | 52.2 | 65.2 | 81.3 | 101.5 |
| Accounts Payable, % | 4.49 | 2.7 | 2.27 | 2.05 | 1.88 | 2.68 | 2.68 | 2.68 | 2.68 | 2.68 |
| Capital Expenditure | -69.0 | -101.5 | -142.6 | -146.2 | -135.5 | -209.5 | -261.4 | -326.2 | -407.1 | -508.0 |
| Capital Expenditure, % | -13.2 | -13.72 | -15.83 | -13.44 | -10.82 | -13.4 | -13.4 | -13.4 | -13.4 | -13.4 |
| Tax Rate, % | 28.34 | 28.34 | 28.34 | 28.34 | 28.34 | 28.34 | 28.34 | 28.34 | 28.34 | 28.34 |
| EBITAT | -44.7 | -9.2 | -24.3 | 22.3 | 11.7 | -27.4 | -34.2 | -42.6 | -53.2 | -66.4 |
| Depreciation | ||||||||||
| Changes in Account Receivables | ||||||||||
| Changes in Inventories | ||||||||||
| Changes in Accounts Payable | ||||||||||
| Capital Expenditure | ||||||||||
| UFCF | -52.4 | -59.1 | -102.8 | -35.2 | -9.2 | -99.6 | -127.9 | -159.7 | -199.2 | -248.6 |
| WACC, % | 10.28 | 10.04 | 10.28 | 10.28 | 10.12 | 10.2 | 10.2 | 10.2 | 10.2 | 10.2 |
| PV UFCF | ||||||||||
| SUM PV UFCF | -603.2 | |||||||||
| Long Term Growth Rate, % | 4.00 | |||||||||
| Free cash flow (T + 1) | -259 | |||||||||
| Terminal Value | -4,170 | |||||||||
| Present Terminal Value | -2,566 | |||||||||
| Enterprise Value | -3,169 | |||||||||
| Net Debt | 489 | |||||||||
| Equity Value | -3,658 | |||||||||
| Diluted Shares Outstanding, MM | 44 | |||||||||
| Equity Value Per Share | -82.75 |
What You Will Get
- Editable Excel Template: A fully customizable Excel-based DCF Calculator featuring pre-filled real SHAK financials.
- Real-World Data: Historical data and forward-looking estimates (as shown in the yellow cells).
- Forecast Flexibility: Adjust forecast assumptions such as revenue growth, EBITDA %, and WACC.
- Automatic Calculations: Instantly observe the impact of your inputs on Shake Shack’s valuation.
- Professional Tool: Designed for investors, CFOs, consultants, and financial analysts.
- User-Friendly Design: Organized for clarity and ease of use, complete with step-by-step instructions.
Key Features
- Customizable Growth Metrics: Adjust essential inputs such as same-store sales growth, operating margin, and capital investments.
- Instant DCF Valuation: Quickly computes intrinsic value, net present value (NPV), and other financial metrics.
- High-Precision Modeling: Leverages Shake Shack’s actual financial data for accurate valuation results.
- Effortless Scenario Testing: Easily evaluate various assumptions and analyze their impacts on outcomes.
- Efficiency Booster: Streamlines the valuation process, removing the need for intricate model development from the ground up.
How It Works
- Download: Obtain the pre-formatted Excel file containing Shake Shack Inc.'s (SHAK) financial metrics.
- Customize: Modify projections such as sales growth, EBITDA margin, and discount rate.
- Update Automatically: The calculations for intrinsic value and net present value refresh in real-time.
- Test Scenarios: Develop various forecasts and instantly evaluate different outcomes.
- Make Decisions: Leverage the valuation insights to inform your investment choices.
Why Choose This Calculator for Shake Shack Inc. (SHAK)?
- Accurate Data: Utilize real financials from Shake Shack for dependable valuation outcomes.
- Customizable: Tailor critical metrics such as growth rates, WACC, and tax rates to fit your forecasts.
- Time-Saving: Built-in calculations save you from starting from the ground up.
- Professional-Grade Tool: Crafted for investors, analysts, and consultants in the food industry.
- User-Friendly: An intuitive design and clear instructions ensure ease of use for everyone.
Who Should Use This Product?
- Professional Investors: Develop comprehensive and accurate valuation models for assessing Shake Shack Inc. (SHAK) investments.
- Corporate Finance Teams: Evaluate valuation scenarios to inform strategic decisions within their organizations.
- Consultants and Advisors: Deliver precise valuation insights for clients interested in Shake Shack Inc. (SHAK) stock.
- Students and Educators: Utilize real-world data to enhance learning and practice in financial modeling.
- Food Industry Analysts: Gain insights into how restaurant chains like Shake Shack Inc. (SHAK) are valued in the market.
What the Template Contains
- Operating and Balance Sheet Data: Pre-filled Shake Shack Inc. (SHAK) historical data and forecasts, including revenue, EBITDA, EBIT, and capital expenditures.
- WACC Calculation: A dedicated sheet for Weighted Average Cost of Capital (WACC), including parameters like Beta, risk-free rate, and share price.
- DCF Valuation (Unlevered and Levered): Editable Discounted Cash Flow models showing intrinsic value with detailed calculations.
- Financial Statements: Pre-loaded financial statements (annual and quarterly) to support analysis.
- Key Ratios: Includes profitability, leverage, and efficiency ratios for Shake Shack Inc. (SHAK).
- Dashboard and Charts: Visual summary of valuation outputs and assumptions to analyze results easily.
Disclaimer
All information, articles, and product details provided on this website are for general informational and educational purposes only. We do not claim any ownership over, nor do we intend to infringe upon, any trademarks, copyrights, logos, brand names, or other intellectual property mentioned or depicted on this site. Such intellectual property remains the property of its respective owners, and any references here are made solely for identification or informational purposes, without implying any affiliation, endorsement, or partnership.
We make no representations or warranties, express or implied, regarding the accuracy, completeness, or suitability of any content or products presented. Nothing on this website should be construed as legal, tax, investment, financial, medical, or other professional advice. In addition, no part of this site—including articles or product references—constitutes a solicitation, recommendation, endorsement, advertisement, or offer to buy or sell any securities, franchises, or other financial instruments, particularly in jurisdictions where such activity would be unlawful.
All content is of a general nature and may not address the specific circumstances of any individual or entity. It is not a substitute for professional advice or services. Any actions you take based on the information provided here are strictly at your own risk. You accept full responsibility for any decisions or outcomes arising from your use of this website and agree to release us from any liability in connection with your use of, or reliance upon, the content or products found herein.