
|
Sintx Technologies ، Inc. (SINT) تقييم DCF |
Fully Editable: Tailor To Your Needs In Excel Or Sheets
Professional Design: Trusted, Industry-Standard Templates
Investor-Approved Valuation Models
MAC/PC Compatible, Fully Unlocked
No Expertise Is Needed; Easy To Follow
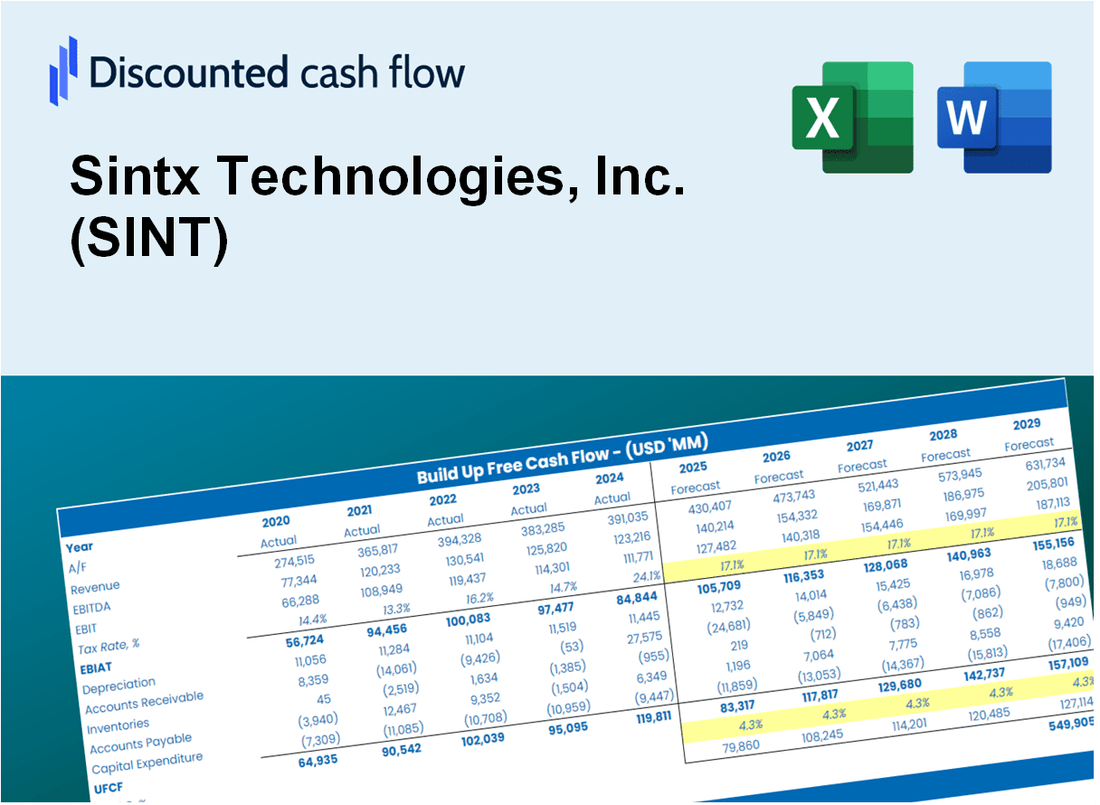
Sintx Technologies, Inc. (SINT) Bundle
هندسة من أجل الدقة ، تمكنك حاسبة DCF لدينا من تقييم التقييم Sintx Technologies ، Inc. باستخدام البيانات المالية في العالم الحقيقي ، مما يوفر مرونة كاملة لتعديل جميع المعلمات الأساسية للتوقعات المحسنة.
Discounted Cash Flow (DCF) - (USD MM)
| Year | AY1 2020 |
AY2 2021 |
AY3 2022 |
AY4 2023 |
AY5 2024 |
FY1 2025 |
FY2 2026 |
FY3 2027 |
FY4 2028 |
FY5 2029 |
|---|---|---|---|---|---|---|---|---|---|---|
| Revenue | .6 | .6 | .6 | 2.6 | 1.2 | 1.4 | 1.6 | 1.8 | 2.0 | 2.2 |
| Revenue Growth, % | 0 | 2.02 | -0.82508 | 337.1 | -52.57 | 12.16 | 12.16 | 12.16 | 12.16 | 12.16 |
| EBITDA | -6.5 | -8.6 | -11.1 | -6.6 | -9.6 | -1.4 | -1.6 | -1.8 | -2.0 | -2.2 |
| EBITDA, % | -1099.16 | -1424.75 | -1840.1 | -251.24 | -771.35 | -100 | -100 | -100 | -100 | -100 |
| Depreciation | .5 | .7 | 1.0 | 1.7 | 1.4 | 1.2 | 1.4 | 1.6 | 1.8 | 2.0 |
| Depreciation, % | 83.84 | 107.26 | 160.23 | 63.08 | 111.08 | 89.38 | 89.38 | 89.38 | 89.38 | 89.38 |
| EBIT | -7.0 | -9.3 | -12.0 | -8.3 | -11.0 | -1.4 | -1.6 | -1.8 | -2.0 | -2.2 |
| EBIT, % | -1183 | -1532.01 | -2000.33 | -314.31 | -882.42 | -100 | -100 | -100 | -100 | -100 |
| Total Cash | 25.4 | 14.3 | 6.2 | 3.3 | 3.6 | 1.4 | 1.6 | 1.8 | 2.0 | 2.2 |
| Total Cash, percent | .0 | .0 | .0 | .0 | .0 | .0 | .0 | .0 | .0 | .0 |
| Account Receivables | 1.9 | .1 | .3 | .7 | .2 | .6 | .7 | .7 | .8 | .9 |
| Account Receivables, % | 319.36 | 16.83 | 54.58 | 26.08 | 15.73 | 42.64 | 42.64 | 42.64 | 42.64 | 42.64 |
| Inventories | .1 | .3 | .3 | .9 | .5 | .5 | .6 | .7 | .7 | .8 |
| Inventories, % | 16.67 | 50 | 47.25 | 33.8 | 40.29 | 37.6 | 37.6 | 37.6 | 37.6 | 37.6 |
| Accounts Payable | .2 | .2 | .4 | .6 | .3 | .5 | .6 | .7 | .8 | .9 |
| Accounts Payable, % | 32.66 | 39.77 | 72.21 | 24.21 | 24 | 38.57 | 38.57 | 38.57 | 38.57 | 38.57 |
| Capital Expenditure | -.4 | -3.7 | -1.4 | -.5 | -.7 | -.9 | -1.1 | -1.2 | -1.3 | -1.5 |
| Capital Expenditure, % | -60.61 | -617.82 | -233.78 | -20.18 | -55.38 | -67.23 | -67.23 | -67.23 | -67.23 | -67.23 |
| Tax Rate, % | 0 | 0 | 0 | 0 | 0 | 0 | 0 | 0 | 0 | 0 |
| EBITAT | -7.0 | -9.3 | -12.0 | -8.3 | -11.0 | -1.4 | -1.6 | -1.8 | -2.0 | -2.2 |
| Depreciation | ||||||||||
| Changes in Account Receivables | ||||||||||
| Changes in Inventories | ||||||||||
| Changes in Accounts Payable | ||||||||||
| Capital Expenditure | ||||||||||
| UFCF | -8.7 | -10.7 | -12.5 | -7.9 | -9.8 | -1.3 | -1.3 | -1.4 | -1.6 | -1.8 |
| WACC, % | 4.91 | 4.91 | 4.91 | 4.91 | 4.91 | 4.91 | 4.91 | 4.91 | 4.91 | 4.91 |
| PV UFCF | ||||||||||
| SUM PV UFCF | -6.4 | |||||||||
| Long Term Growth Rate, % | 2.00 | |||||||||
| Free cash flow (T + 1) | -2 | |||||||||
| Terminal Value | -64 | |||||||||
| Present Terminal Value | -50 | |||||||||
| Enterprise Value | -57 | |||||||||
| Net Debt | 0 | |||||||||
| Equity Value | -57 | |||||||||
| Diluted Shares Outstanding, MM | 1 | |||||||||
| Equity Value Per Share | -76.64 |
What You Will Get
- Real SINT Financials: Access to historical and projected data for precise valuation.
- Customizable Inputs: Adjust WACC, tax rates, revenue growth, and capital expenditures as needed.
- Dynamic Calculations: Intrinsic value and NPV are computed in real-time.
- Scenario Analysis: Evaluate various scenarios to assess Sintx Technologies' future performance.
- User-Friendly Design: Designed for professionals while remaining approachable for newcomers.
Core Benefits
- Accurate Sintx Financials: Gain access to reliable pre-loaded historical data and future forecasts.
- Adjustable Forecast Parameters: Modify highlighted cells such as WACC, growth rates, and profit margins.
- Real-Time Calculations: Automatic updates for DCF, Net Present Value (NPV), and cash flow assessments.
- Interactive Dashboard: User-friendly charts and summaries to help visualize your valuation outcomes.
- Designed for All Users: An intuitive layout tailored for investors, CFOs, and consultants alike.
How It Works
- Step 1: Download the prebuilt Excel template containing Sintx Technologies, Inc. (SINT) data.
- Step 2: Review the pre-filled sheets to familiarize yourself with the essential metrics.
- Step 3: Modify forecasts and assumptions in the editable yellow cells (WACC, growth, margins).
- Step 4: Instantly observe the recalculated results, including Sintx Technologies, Inc.'s (SINT) intrinsic value.
- Step 5: Make well-informed investment decisions or create reports based on the outputs.
Why Choose This Calculator for Sintx Technologies, Inc. (SINT)?
- User-Friendly Interface: Perfect for both novices and seasoned professionals.
- Customizable Inputs: Adjust parameters to suit your specific analysis needs.
- Real-Time Valuation Changes: Monitor immediate updates to Sintx's valuation as you make adjustments.
- Pre-Loaded Financial Data: Comes equipped with Sintx's latest financial information for fast evaluation.
- Relied Upon by Experts: A go-to tool for investors and analysts aiming for informed decision-making.
Who Should Use This Product?
- Professional Investors: Create comprehensive and trustworthy valuation models for analyzing investments in Sintx Technologies, Inc. (SINT).
- Corporate Finance Teams: Evaluate valuation scenarios to inform strategic decisions within their organizations.
- Consultants and Advisors: Offer clients precise valuation insights related to Sintx Technologies, Inc. (SINT).
- Students and Educators: Utilize real-world data to enhance learning and practice in financial modeling.
- Tech Enthusiasts: Gain insights into how companies like Sintx Technologies, Inc. (SINT) are valued in the technology sector.
What the Template Contains
- Pre-Filled DCF Model: Sintx Technologies’ financial data preloaded for immediate use.
- WACC Calculator: Detailed calculations for Weighted Average Cost of Capital.
- Financial Ratios: Evaluate Sintx Technologies’ profitability, leverage, and efficiency.
- Editable Inputs: Change assumptions such as growth, margins, and CAPEX to fit your scenarios.
- Financial Statements: Annual and quarterly reports to support detailed analysis.
- Interactive Dashboard: Easily visualize key valuation metrics and results.
Disclaimer
All information, articles, and product details provided on this website are for general informational and educational purposes only. We do not claim any ownership over, nor do we intend to infringe upon, any trademarks, copyrights, logos, brand names, or other intellectual property mentioned or depicted on this site. Such intellectual property remains the property of its respective owners, and any references here are made solely for identification or informational purposes, without implying any affiliation, endorsement, or partnership.
We make no representations or warranties, express or implied, regarding the accuracy, completeness, or suitability of any content or products presented. Nothing on this website should be construed as legal, tax, investment, financial, medical, or other professional advice. In addition, no part of this site—including articles or product references—constitutes a solicitation, recommendation, endorsement, advertisement, or offer to buy or sell any securities, franchises, or other financial instruments, particularly in jurisdictions where such activity would be unlawful.
All content is of a general nature and may not address the specific circumstances of any individual or entity. It is not a substitute for professional advice or services. Any actions you take based on the information provided here are strictly at your own risk. You accept full responsibility for any decisions or outcomes arising from your use of this website and agree to release us from any liability in connection with your use of, or reliance upon, the content or products found herein.