
|
Nuscale Power Corporation (SMR) DCF تقييم |
Fully Editable: Tailor To Your Needs In Excel Or Sheets
Professional Design: Trusted, Industry-Standard Templates
Investor-Approved Valuation Models
MAC/PC Compatible, Fully Unlocked
No Expertise Is Needed; Easy To Follow
NuScale Power Corporation (SMR) Bundle
تقييم التوقعات المالية لشركة Nuscale Power Corporation كخبير! توفر حاسبة DCF (SMR) هذه المالية المملوءة مسبقًا إلى جانب المرونة لتعديل نمو الإيرادات ، WACC ، الهوامش ، وغيرها من الافتراضات الحاسمة التي تتماشى مع توقعاتك.
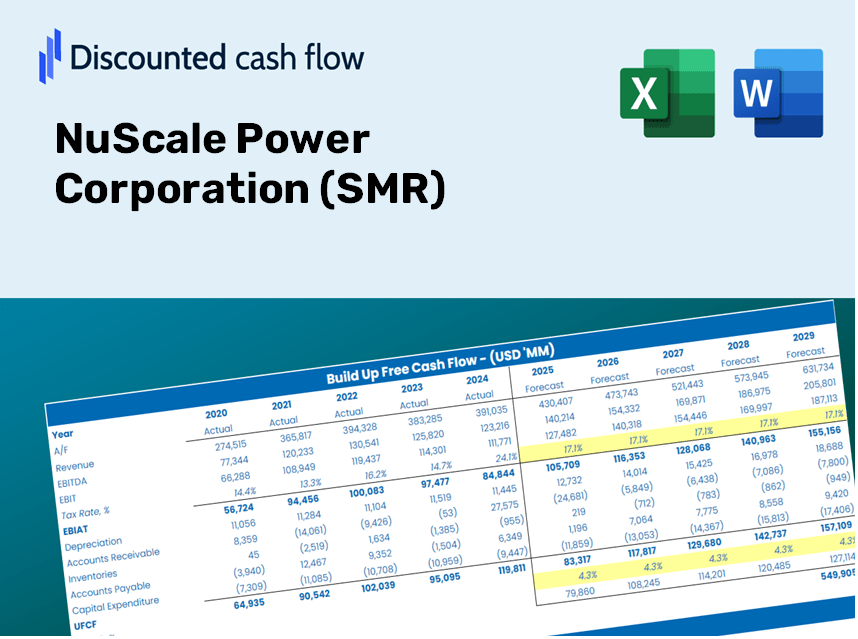
Discounted Cash Flow (DCF) - (USD MM)
| Year | AY1 2020 |
AY2 2021 |
AY3 2022 |
AY4 2023 |
AY5 2024 |
FY1 2025 |
FY2 2026 |
FY3 2027 |
FY4 2028 |
FY5 2029 |
|---|---|---|---|---|---|---|---|---|---|---|
| Revenue | .6 | 2.9 | 11.8 | 22.8 | 37.0 | 70.0 | 132.2 | 249.8 | 471.8 | 891.3 |
| Revenue Growth, % | 0 | 377 | 312.44 | 93.24 | 62.41 | 88.91 | 88.91 | 88.91 | 88.91 | 88.91 |
| EBITDA | -156.8 | -172.1 | -227.3 | -273.0 | -133.6 | -70.0 | -132.2 | -249.8 | -471.8 | -891.3 |
| EBITDA, % | -26127.5 | -6013.45 | -1925.59 | -1196.88 | -360.77 | -100 | -100 | -100 | -100 | -100 |
| Depreciation | 2.1 | 2.2 | 2.7 | 2.6 | 1.8 | 30.2 | 57.0 | 107.8 | 203.6 | 384.6 |
| Depreciation, % | 346.33 | 76.69 | 22.86 | 11.21 | 4.97 | 43.15 | 43.15 | 43.15 | 43.15 | 43.15 |
| EBIT | -158.8 | -174.3 | -230.0 | -275.6 | -135.5 | -70.0 | -132.2 | -249.8 | -471.8 | -891.3 |
| EBIT, % | -26473.83 | -6090.15 | -1948.45 | -1208.09 | -365.74 | -100 | -100 | -100 | -100 | -100 |
| Total Cash | 4.9 | 77.1 | 267.7 | 120.3 | 441.6 | 70.0 | 132.2 | 249.8 | 471.8 | 891.3 |
| Total Cash, percent | .0 | .0 | .0 | .0 | .0 | .0 | .0 | .0 | .0 | .0 |
| Account Receivables | 2.8 | 4.8 | 11.2 | 10.1 | 21.1 | 55.5 | 104.8 | 197.9 | 373.9 | 706.3 |
| Account Receivables, % | 465 | 168.87 | 94.87 | 44.4 | 56.97 | 79.25 | 79.25 | 79.25 | 79.25 | 79.25 |
| Inventories | .0 | .0 | .0 | .0 | .0 | .0 | .0 | .0 | .0 | .0 |
| Inventories, % | 0 | 0 | 0 | 0 | 0 | 0 | 0 | 0 | 0 | 0 |
| Accounts Payable | 14.6 | 18.5 | 20.3 | 40.8 | 47.9 | 70.0 | 132.2 | 249.8 | 471.8 | 891.3 |
| Accounts Payable, % | 2427.5 | 646.19 | 171.61 | 179.07 | 129.43 | 100 | 100 | 100 | 100 | 100 |
| Capital Expenditure | -3.5 | -2.0 | -2.3 | -1.7 | .0 | -27.4 | -51.7 | -97.7 | -184.6 | -348.7 |
| Capital Expenditure, % | -587.67 | -68.2 | -19.76 | -7.56 | -0.11877 | -39.13 | -39.13 | -39.13 | -39.13 | -39.13 |
| Tax Rate, % | 60.57 | 60.57 | 60.57 | 60.57 | 60.57 | 60.57 | 60.57 | 60.57 | 60.57 | 60.57 |
| EBITAT | -158.8 | -174.3 | -92.7 | -89.3 | -53.4 | -43.7 | -82.5 | -155.9 | -294.5 | -556.4 |
| Depreciation | ||||||||||
| Changes in Account Receivables | ||||||||||
| Changes in Inventories | ||||||||||
| Changes in Accounts Payable | ||||||||||
| Capital Expenditure | ||||||||||
| UFCF | -148.5 | -172.2 | -96.9 | -66.8 | -55.5 | -53.2 | -64.3 | -121.5 | -229.5 | -433.6 |
| WACC, % | 13.17 | 13.17 | 13.17 | 13.17 | 13.17 | 13.17 | 13.17 | 13.17 | 13.17 | 13.17 |
| PV UFCF | ||||||||||
| SUM PV UFCF | -554.6 | |||||||||
| Long Term Growth Rate, % | 2.00 | |||||||||
| Free cash flow (T + 1) | -442 | |||||||||
| Terminal Value | -3,960 | |||||||||
| Present Terminal Value | -2,134 | |||||||||
| Enterprise Value | -2,688 | |||||||||
| Net Debt | -402 | |||||||||
| Equity Value | -2,287 | |||||||||
| Diluted Shares Outstanding, MM | 93 | |||||||||
| Equity Value Per Share | -24.52 |
ماذا ستتلقى
- البيانات المالية الدقيقة: يتميز كل من البيانات التاريخية والمتوقعة للتقييم الدقيق.
- مدخلات قابلة للتخصيص: اضبط WACC ومعدلات الضرائب ونمو الإيرادات والنفقات الرأسمالية حسب الحاجة.
- الحسابات في الوقت الحقيقي: يتم حساب القيمة الجوهرية و NPV تلقائيًا.
- تحليل السيناريو: تقييم السيناريوهات المختلفة لتقييم الأداء المستقبلي لشركة Nuscale Power Corporation (SMR).
- تصميم سهل الاستخدام: مصممة للمهنيين مع بقاء متاح للوافدين الجدد.
الميزات الرئيسية
- حاسبة DCF شاملة: يضم نماذج تقييم DCF مفصلة غير محفوظة ومحفوظة مصممة خصيصًا لشركة Nuscale Power Corporation (SMR).
- حاسبة WACC: يوفر متوسط تكلفة مرجح مسبقًا للورقة الرأسمالية مع معلمات إدخال قابلة للتعديل.
- افتراضات التنبؤ القابلة للتخصيص: بسهولة تغيير معدلات النمو والنفقات الرأسمالية ومعدلات الخصم.
- النسب المالية المتكاملة: تقييم نسب الربحية والرافعة المالية والكفاءة خصيصًا لشركة Nuscale Power Corporation (SMR).
- لوحة القيادة التفاعلية والمخططات: تلخص التمثيلات البصرية مقاييس التقييم الأساسية للتحليل المباشر.
كيف تعمل
- الخطوة 1: قم بتنزيل ملف Excel.
- الخطوة 2: فحص البيانات المالية المملوءة مسبقًا بمؤسسة Nuscale Power (SMR).
- الخطوة 3: ضبط المدخلات الرئيسية مثل نمو الإيرادات ، WACC ، ومعدلات الضرائب (الخلايا المميزة).
- الخطوة 4: راقب تحديث نموذج DCF في الوقت الفعلي أثناء تعديل افتراضاتك.
- الخطوة 5: تقييم المخرجات لإبلاغ قرارات الاستثمار الخاصة بك.
لماذا تختار هذه الآلة الحاسبة؟
- مصمم للخبراء: أداة متطورة تستخدمها محللي الطاقة والمديرين التنفيذيين والمستشارين في الصناعة.
- بيانات دقيقة: البيانات المالية والمتوقعة لشركة Nuscale Power Corporation المحملة للتنبؤ الموثوق.
- تحليل السيناريو المرن: اختبار دون عناء التنبؤات والافتراضات.
- مخرجات شاملة: يحسب تلقائيًا القيمة الجوهرية ، NPV ، والمقاييس الأساسية.
- سهل الاستخدام: إرشادات بديهية خطوة بخطوة لتبسيط تجربتك.
من يمكنه الاستفادة من هذا المنتج؟
- محترفي الاستثمار: تطوير نماذج تقييم شاملة يمكن الاعتماد عليها لتقييمات المحفظة.
- إدارات تمويل الشركات: فحص سيناريوهات التقييم لإبلاغ اتخاذ القرارات الاستراتيجية.
- الاستشاريون والمستشارون: تقديم رؤى تقييم دقيقة لشركة Nuscale Power Corporation (SMR) للعملاء.
- الطلاب والمدربين: الاستفادة من بيانات العالم الحقيقي لتعزيز التعلم في النمذجة المالية.
- عشاق قطاع الطاقة: اكتساب رؤى حول كيفية تقييم شركات مثل Nuscale Power Corporation (SMR) في السوق.
ما يتضمنه القالب
- نموذج DCF الشامل: قالب قابل للتحرير يضم حسابات التقييم المتعمقة.
- بيانات العالم الحقيقي: تم تحميل البيانات المالية التاريخية والمتوقعة في Nuscale Power Corporation (SMR) للتحليل الشامل.
- المعلمات القابلة للتخصيص: تعديل WACC ومعدلات النمو والافتراضات الضريبية لاستكشاف السيناريوهات المختلفة.
- البيانات المالية: الانهيار السنوي والفصلي الكامل لتصوير رؤى محسنة.
- النسب الرئيسية: تحليل متكامل للربحية والكفاءة والرافعة المالية.
- لوحة القيادة مع المخرجات المرئية: المخططات والجداول التي تعرض نتائج واضحة وقابلة للتنفيذ.
Disclaimer
All information, articles, and product details provided on this website are for general informational and educational purposes only. We do not claim any ownership over, nor do we intend to infringe upon, any trademarks, copyrights, logos, brand names, or other intellectual property mentioned or depicted on this site. Such intellectual property remains the property of its respective owners, and any references here are made solely for identification or informational purposes, without implying any affiliation, endorsement, or partnership.
We make no representations or warranties, express or implied, regarding the accuracy, completeness, or suitability of any content or products presented. Nothing on this website should be construed as legal, tax, investment, financial, medical, or other professional advice. In addition, no part of this site—including articles or product references—constitutes a solicitation, recommendation, endorsement, advertisement, or offer to buy or sell any securities, franchises, or other financial instruments, particularly in jurisdictions where such activity would be unlawful.
All content is of a general nature and may not address the specific circumstances of any individual or entity. It is not a substitute for professional advice or services. Any actions you take based on the information provided here are strictly at your own risk. You accept full responsibility for any decisions or outcomes arising from your use of this website and agree to release us from any liability in connection with your use of, or reliance upon, the content or products found herein.