
|
SNAP-ON Incorporated (SNA) تقييم DCF |
Fully Editable: Tailor To Your Needs In Excel Or Sheets
Professional Design: Trusted, Industry-Standard Templates
Investor-Approved Valuation Models
MAC/PC Compatible, Fully Unlocked
No Expertise Is Needed; Easy To Follow
Snap-on Incorporated (SNA) Bundle
عزز خيارات الاستثمار الخاصة بك مع حاسبة DCF SNAP-ON Incorporated (SNA)! استكشاف البيانات المالية الأصلية ، وضبط تنبؤات النمو والنفقات ، ومراقبة على الفور كيف تؤثر هذه التعديلات على القيمة الجوهرية لـ SNAP-ON.
What You Will Get
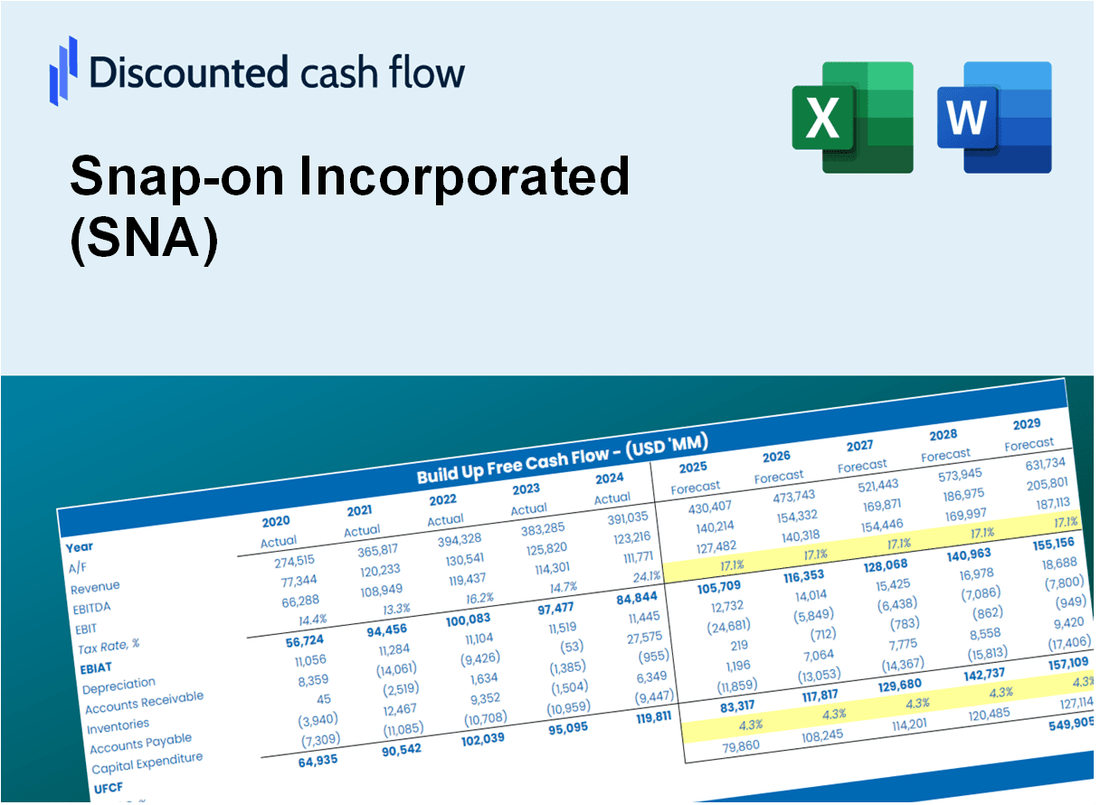
- Pre-Filled Financial Model: Snap-on Incorporated’s (SNA) actual data provides an accurate basis for DCF valuation.
- Full Forecast Control: Modify revenue growth, profit margins, WACC, and other essential drivers.
- Instant Calculations: Automatic updates allow you to view results in real-time as you make adjustments.
- Investor-Ready Template: A polished Excel file crafted for high-quality valuation presentations.
- Customizable and Reusable: Designed for adaptability, enabling repeated use for comprehensive forecasts.
Key Features
- Real-Life SNA Data: Pre-filled with Snap-on's historical financials and future projections.
- Fully Customizable Inputs: Modify revenue growth, profit margins, WACC, tax rates, and capital expenditures to fit your analysis.
- Dynamic Valuation Model: Automatic recalculations of Net Present Value (NPV) and intrinsic value based on your custom inputs.
- Scenario Testing: Develop multiple forecasting scenarios to explore various valuation outcomes.
- User-Friendly Design: Intuitive layout, structured for both professionals and newcomers.
How It Works
- Step 1: Download the Excel file.
- Step 2: Review pre-entered Snap-on Incorporated (SNA) data (historical and projected).
- Step 3: Adjust key assumptions (yellow cells) based on your analysis.
- Step 4: View automatic recalculations for Snap-on Incorporated’s intrinsic value.
- Step 5: Use the outputs for investment decisions or reporting.
Why Choose This Calculator for Snap-on Incorporated (SNA)?
- Accuracy: Utilizes real Snap-on financials to ensure precise data.
- Flexibility: Allows users to easily test and adjust inputs as needed.
- Time-Saving: Eliminate the need to create a DCF model from the ground up.
- Professional-Grade: Crafted with the precision and usability expected by CFOs.
- User-Friendly: Intuitive design makes it accessible for users without advanced financial modeling skills.
Who Should Use Snap-on Incorporated (SNA)?
- Investors: Gain insights into a leading tool manufacturer to make informed investment choices.
- Financial Analysts: Utilize comprehensive financial data to enhance your analysis of Snap-on's performance.
- Consultants: Tailor presentations or reports with Snap-on's strong market position and product offerings.
- Industry Enthusiasts: Explore Snap-on's innovative tools and services to enrich your knowledge of the industry.
- Educators and Students: Leverage real-world case studies from Snap-on in business and finance curricula.
What the Template Contains
- Preloaded SNA Data: Historical and projected financial data, including revenue, EBIT, and capital expenditures.
- DCF and WACC Models: Professional-grade sheets for calculating intrinsic value and Weighted Average Cost of Capital.
- Editable Inputs: Yellow-highlighted cells for adjusting revenue growth, tax rates, and discount rates.
- Financial Statements: Comprehensive annual and quarterly financials for deeper analysis.
- Key Ratios: Profitability, leverage, and efficiency ratios to evaluate performance.
- Dashboard and Charts: Visual summaries of valuation outcomes and assumptions.
Disclaimer
All information, articles, and product details provided on this website are for general informational and educational purposes only. We do not claim any ownership over, nor do we intend to infringe upon, any trademarks, copyrights, logos, brand names, or other intellectual property mentioned or depicted on this site. Such intellectual property remains the property of its respective owners, and any references here are made solely for identification or informational purposes, without implying any affiliation, endorsement, or partnership.
We make no representations or warranties, express or implied, regarding the accuracy, completeness, or suitability of any content or products presented. Nothing on this website should be construed as legal, tax, investment, financial, medical, or other professional advice. In addition, no part of this site—including articles or product references—constitutes a solicitation, recommendation, endorsement, advertisement, or offer to buy or sell any securities, franchises, or other financial instruments, particularly in jurisdictions where such activity would be unlawful.
All content is of a general nature and may not address the specific circumstances of any individual or entity. It is not a substitute for professional advice or services. Any actions you take based on the information provided here are strictly at your own risk. You accept full responsibility for any decisions or outcomes arising from your use of this website and agree to release us from any liability in connection with your use of, or reliance upon, the content or products found herein.