
|
Sensei Biotheraputics ، Inc. (SNSE) DCF تقييم |
Fully Editable: Tailor To Your Needs In Excel Or Sheets
Professional Design: Trusted, Industry-Standard Templates
Investor-Approved Valuation Models
MAC/PC Compatible, Fully Unlocked
No Expertise Is Needed; Easy To Follow
Sensei Biotherapeutics, Inc. (SNSE) Bundle
تبسيط التقييم Sensei Biotherapeutics ، Inc. (SNSE) مع هذه الآلة الحاسبة DCF القابلة للتخصيص! يضم Real Sensei Biotherapeutics ، Inc. (SNSE) ومدخلات التنبؤ القابلة للتعديل ، يمكنك اختبار السيناريوهات وكشف القيمة العادلة Sensei Biotheraputics ، Inc. (SNSE) في دقائق.
What You Will Get
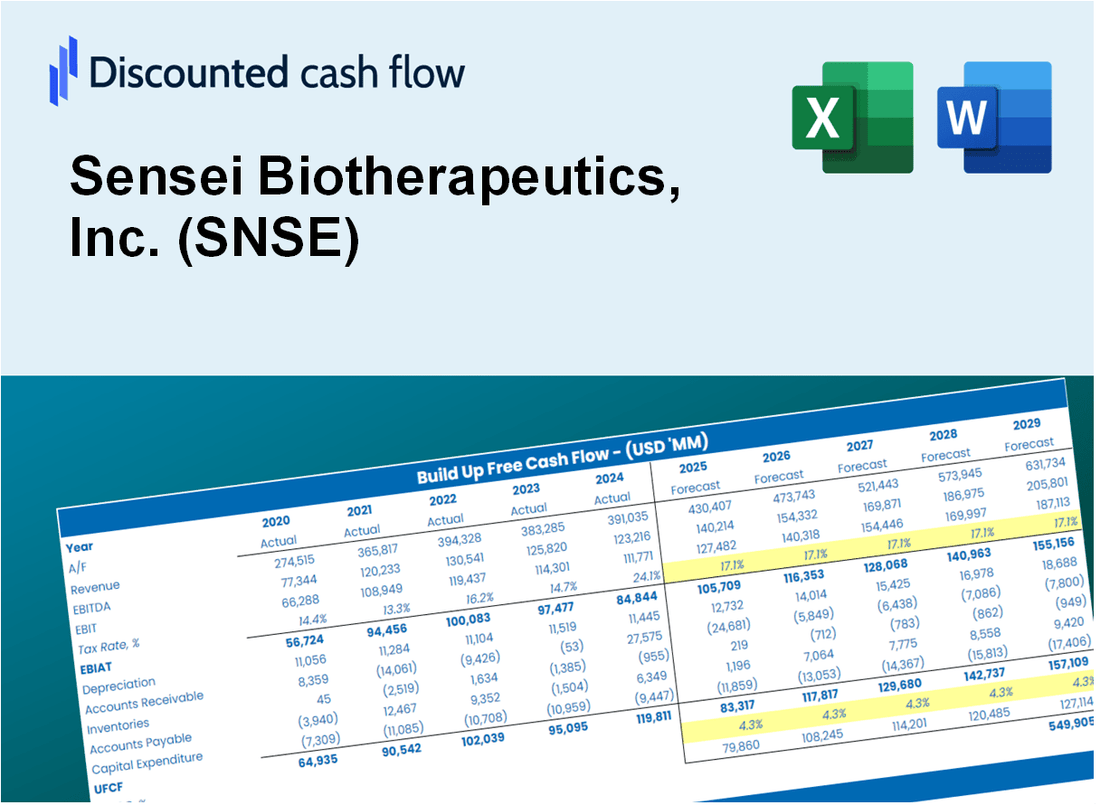
- Real Sensei Biotherapeutics Data: Preloaded financials – from revenue to EBIT – based on actual and projected figures for Sensei Biotherapeutics, Inc. (SNSE).
- Full Customization: Adjust all critical parameters (yellow cells) like WACC, growth %, and tax rates specific to Sensei Biotherapeutics, Inc. (SNSE).
- Instant Valuation Updates: Automatic recalculations to analyze the impact of changes on Sensei Biotherapeutics, Inc. (SNSE)’s fair value.
- Versatile Excel Template: Tailored for quick edits, scenario testing, and detailed projections for Sensei Biotherapeutics, Inc. (SNSE).
- Time-Saving and Accurate: Skip building models from scratch while maintaining precision and flexibility for Sensei Biotherapeutics, Inc. (SNSE).
Key Features
- Comprehensive SNSE Data: Pre-filled with Sensei Biotherapeutics’ historical performance and future growth projections.
- Fully Customizable Inputs: Modify revenue growth rates, profit margins, discount rates, tax implications, and investment expenditures.
- Dynamic Valuation Model: Instant updates to Net Present Value (NPV) and intrinsic value based on your specified parameters.
- Scenario Analysis: Develop various forecasting scenarios to evaluate different valuation possibilities.
- User-Friendly Interface: Intuitive, organized, and crafted for both seasoned professionals and newcomers.
How It Works
- Step 1: Download the prebuilt Excel template featuring Sensei Biotherapeutics, Inc. (SNSE) data.
- Step 2: Navigate through the pre-filled sheets to understand the essential metrics.
- Step 3: Modify forecasts and assumptions in the editable yellow cells (WACC, growth, margins).
- Step 4: Instantly see the recalculated results, including Sensei Biotherapeutics, Inc. (SNSE)'s intrinsic value.
- Step 5: Make well-informed investment decisions or create reports based on the outputs.
Why Choose Sensei Biotherapeutics, Inc. (SNSE)?
- Innovative Solutions: Cutting-edge biotherapeutics designed to address unmet medical needs.
- Proven Expertise: A team of industry veterans with extensive experience in drug development.
- Robust Pipeline: A diverse range of therapeutic candidates targeting various diseases.
- Commitment to Quality: Adherence to the highest regulatory standards ensures safety and efficacy.
- Collaborative Approach: Partnerships with leading research institutions to enhance innovation.
Who Should Use This Product?
- Professional Investors: Develop comprehensive and accurate valuation models for analyzing Sensei Biotherapeutics, Inc. (SNSE) investments.
- Corporate Finance Teams: Evaluate valuation scenarios to inform strategic decisions within the company.
- Consultants and Advisors: Offer clients precise valuation insights for Sensei Biotherapeutics, Inc. (SNSE) stock.
- Students and Educators: Utilize real-world data to enhance learning and practice in financial modeling.
- Biotech Enthusiasts: Gain insights into how biotech companies like Sensei Biotherapeutics, Inc. (SNSE) are valued in the financial markets.
What the Template Contains
- Preloaded SNSE Data: Historical and projected financial data, including revenue, EBIT, and capital expenditures.
- DCF and WACC Models: Professional-grade sheets for calculating intrinsic value and Weighted Average Cost of Capital.
- Editable Inputs: Yellow-highlighted cells for adjusting revenue growth, tax rates, and discount rates.
- Financial Statements: Comprehensive annual and quarterly financials for deeper analysis.
- Key Ratios: Profitability, leverage, and efficiency ratios to evaluate performance.
- Dashboard and Charts: Visual summaries of valuation outcomes and assumptions.
Disclaimer
All information, articles, and product details provided on this website are for general informational and educational purposes only. We do not claim any ownership over, nor do we intend to infringe upon, any trademarks, copyrights, logos, brand names, or other intellectual property mentioned or depicted on this site. Such intellectual property remains the property of its respective owners, and any references here are made solely for identification or informational purposes, without implying any affiliation, endorsement, or partnership.
We make no representations or warranties, express or implied, regarding the accuracy, completeness, or suitability of any content or products presented. Nothing on this website should be construed as legal, tax, investment, financial, medical, or other professional advice. In addition, no part of this site—including articles or product references—constitutes a solicitation, recommendation, endorsement, advertisement, or offer to buy or sell any securities, franchises, or other financial instruments, particularly in jurisdictions where such activity would be unlawful.
All content is of a general nature and may not address the specific circumstances of any individual or entity. It is not a substitute for professional advice or services. Any actions you take based on the information provided here are strictly at your own risk. You accept full responsibility for any decisions or outcomes arising from your use of this website and agree to release us from any liability in connection with your use of, or reliance upon, the content or products found herein.