
|
TD Synnex Corporation (SNX) DCF تقييم |
Fully Editable: Tailor To Your Needs In Excel Or Sheets
Professional Design: Trusted, Industry-Standard Templates
Investor-Approved Valuation Models
MAC/PC Compatible, Fully Unlocked
No Expertise Is Needed; Easy To Follow
TD SYNNEX Corporation (SNX) Bundle
تولي مسؤولية تحليل تقييم TD Synnex Corporation (SNX) مع حاسبة DCF المتطورة! تم تحميله مسبقًا ببيانات SNX الحقيقية ، يمكّنك قالب Excel من ضبط التوقعات والافتراضات لتحديد القيمة الجوهرية لشركة TD Synnex Corporation بدقة.
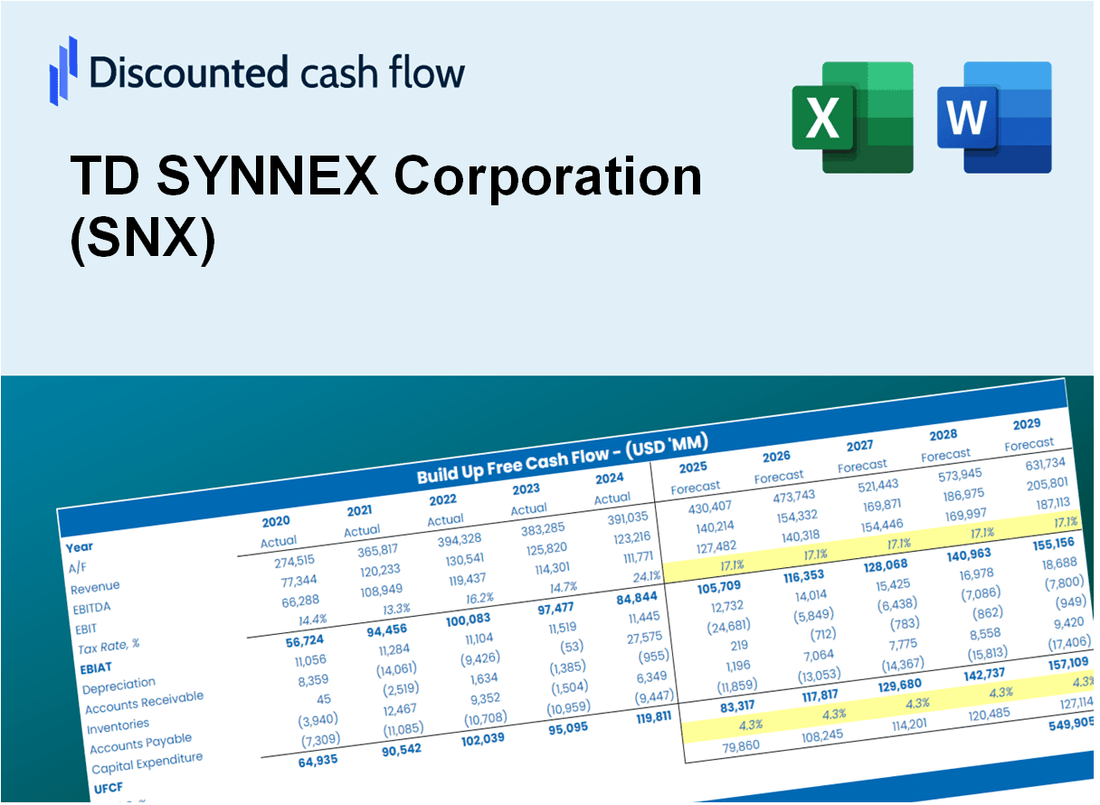
Discounted Cash Flow (DCF) - (USD MM)
| Year | AY1 2020 |
AY2 2021 |
AY3 2022 |
AY4 2023 |
AY5 2024 |
FY1 2025 |
FY2 2026 |
FY3 2027 |
FY4 2028 |
FY5 2029 |
|---|---|---|---|---|---|---|---|---|---|---|
| Revenue | 19,977.2 | 31,614.2 | 62,343.8 | 57,555.4 | 58,452.4 | 61,485.4 | 64,675.8 | 68,031.7 | 71,561.7 | 75,274.9 |
| Revenue Growth, % | 0 | 58.25 | 97.2 | -7.68 | 1.56 | 5.19 | 5.19 | 5.19 | 5.19 | 5.19 |
| EBITDA | 545.2 | 731.9 | 1,488.4 | 1,514.8 | 1,603.3 | 1,574.8 | 1,656.5 | 1,742.5 | 1,832.9 | 1,928.0 |
| EBITDA, % | 2.73 | 2.32 | 2.39 | 2.63 | 2.74 | 2.56 | 2.56 | 2.56 | 2.56 | 2.56 |
| Depreciation | 65.1 | 149.6 | 463.4 | 418.3 | 407.5 | 364.7 | 383.7 | 403.6 | 424.5 | 446.5 |
| Depreciation, % | 0.32573 | 0.47309 | 0.74324 | 0.7268 | 0.6972 | 0.59321 | 0.59321 | 0.59321 | 0.59321 | 0.59321 |
| EBIT | 480.1 | 582.3 | 1,025.1 | 1,096.5 | 1,195.8 | 1,210.1 | 1,272.9 | 1,338.9 | 1,408.4 | 1,481.4 |
| EBIT, % | 2.4 | 1.84 | 1.64 | 1.91 | 2.05 | 1.97 | 1.97 | 1.97 | 1.97 | 1.97 |
| Total Cash | 1,412.0 | 994.0 | 522.6 | 1,033.8 | 1,059.4 | 1,802.6 | 1,896.2 | 1,994.6 | 2,098.0 | 2,206.9 |
| Total Cash, percent | .0 | .0 | .0 | .0 | .0 | .0 | .0 | .0 | .0 | .0 |
| Account Receivables | 3,078.0 | 9,429.0 | 10,240.1 | 11,262.1 | 11,299.7 | 12,365.6 | 13,007.2 | 13,682.1 | 14,392.1 | 15,138.9 |
| Account Receivables, % | 15.41 | 29.83 | 16.43 | 19.57 | 19.33 | 20.11 | 20.11 | 20.11 | 20.11 | 20.11 |
| Inventories | 2,684.1 | 6,642.9 | 9,066.6 | 7,146.3 | 8,287.0 | 9,294.7 | 9,777.0 | 10,284.3 | 10,818.0 | 11,379.3 |
| Inventories, % | 13.44 | 21.01 | 14.54 | 12.42 | 14.18 | 15.12 | 15.12 | 15.12 | 15.12 | 15.12 |
| Accounts Payable | 3,751.2 | 12,034.9 | 13,989.0 | 13,347.3 | 15,084.1 | 15,774.7 | 16,593.3 | 17,454.3 | 18,359.9 | 19,312.6 |
| Accounts Payable, % | 18.78 | 38.07 | 22.44 | 23.19 | 25.81 | 25.66 | 25.66 | 25.66 | 25.66 | 25.66 |
| Capital Expenditure | -198.0 | -54.9 | -117.0 | -150.0 | -175.1 | -235.2 | -247.4 | -260.2 | -273.7 | -287.9 |
| Capital Expenditure, % | -0.99096 | -0.17363 | -0.18775 | -0.26063 | -0.29958 | -0.38251 | -0.38251 | -0.38251 | -0.38251 | -0.38251 |
| Tax Rate, % | 20.43 | 20.43 | 20.43 | 20.43 | 20.43 | 20.43 | 20.43 | 20.43 | 20.43 | 20.43 |
| EBITAT | 582.5 | 493.2 | 807.2 | 870.7 | 951.5 | 1,022.3 | 1,075.3 | 1,131.1 | 1,189.8 | 1,251.5 |
| Depreciation | ||||||||||
| Changes in Account Receivables | ||||||||||
| Changes in Inventories | ||||||||||
| Changes in Accounts Payable | ||||||||||
| Capital Expenditure | ||||||||||
| UFCF | -1,561.3 | -1,438.2 | -127.3 | 1,395.6 | 1,742.4 | -231.1 | 906.2 | 953.2 | 1,002.7 | 1,054.7 |
| WACC, % | 9.09 | 8.8 | 8.68 | 8.7 | 8.7 | 8.79 | 8.79 | 8.79 | 8.79 | 8.79 |
| PV UFCF | ||||||||||
| SUM PV UFCF | 2,701.3 | |||||||||
| Long Term Growth Rate, % | 2.00 | |||||||||
| Free cash flow (T + 1) | 1,076 | |||||||||
| Terminal Value | 15,838 | |||||||||
| Present Terminal Value | 10,392 | |||||||||
| Enterprise Value | 13,094 | |||||||||
| Net Debt | 3,343 | |||||||||
| Equity Value | 9,751 | |||||||||
| Diluted Shares Outstanding, MM | 86 | |||||||||
| Equity Value Per Share | 113.55 |
What You Will Get
- Comprehensive Financial Model: TD SYNNEX Corporation’s actual data facilitates accurate DCF valuation.
- Complete Forecast Flexibility: Modify revenue growth, profit margins, WACC, and other essential parameters.
- Real-Time Calculations: Automatic updates provide immediate results as adjustments are made.
- Professional-Grade Template: A polished Excel file crafted for high-quality valuation.
- Adaptable and Reusable: Designed for versatility, allowing for repeated application in detailed forecasting.
Key Features
- Comprehensive SNX Data: Pre-filled with TD SYNNEX Corporation’s historical financials and future projections.
- Fully Customizable Inputs: Modify revenue growth, profit margins, WACC, tax rates, and capital expenditures as needed.
- Dynamic Valuation Model: Automatic recalculations of Net Present Value (NPV) and intrinsic value based on user inputs.
- Scenario Testing: Develop multiple forecasting scenarios to explore various valuation results.
- User-Friendly Design: Intuitive, organized, and suitable for both professionals and novices.
How It Works
- 1. Access the Template: Download and open the Excel file containing TD SYNNEX Corporation's (SNX) preloaded data.
- 2. Adjust Assumptions: Modify key inputs such as growth rates, WACC, and capital expenditures to fit your analysis.
- 3. View Results Instantly: The DCF model automatically computes intrinsic value and NPV based on your inputs.
- 4. Explore Scenarios: Evaluate various forecasts to understand different valuation possibilities.
- 5. Utilize with Assurance: Deliver insightful valuation findings to enhance your decision-making process.
Why Choose This Calculator for TD SYNNEX Corporation (SNX)?
- Accurate Data: Up-to-date TD SYNNEX financials provide trustworthy valuation outcomes.
- Customizable: Modify essential parameters like growth rates, WACC, and tax rates to fit your forecasts.
- Time-Saving: Pre-configured calculations save you from starting from the ground up.
- Professional-Grade Tool: Tailored for investors, analysts, and consultants in the tech distribution sector.
- User-Friendly: Simple layout and clear instructions ensure accessibility for all users.
Who Should Use This Product?
- Professional Investors: Develop comprehensive and accurate valuation models for portfolio management related to TD SYNNEX Corporation (SNX).
- Corporate Finance Teams: Evaluate valuation scenarios to inform strategic decisions within the organization.
- Consultants and Advisors: Deliver precise valuation insights for clients interested in TD SYNNEX Corporation (SNX).
- Students and Educators: Utilize real-world data to enhance learning and practice in financial modeling.
- Tech Enthusiasts: Gain insights into how technology companies like TD SYNNEX Corporation (SNX) are valued in the marketplace.
What the Template Contains
- Preloaded SNX Data: Historical and projected financial data, including revenue, EBIT, and capital expenditures.
- DCF and WACC Models: Professional-grade sheets for calculating intrinsic value and Weighted Average Cost of Capital.
- Editable Inputs: Yellow-highlighted cells for adjusting revenue growth, tax rates, and discount rates.
- Financial Statements: Comprehensive annual and quarterly financials for deeper analysis.
- Key Ratios: Profitability, leverage, and efficiency ratios to evaluate performance.
- Dashboard and Charts: Visual summaries of valuation outcomes and assumptions.
Disclaimer
All information, articles, and product details provided on this website are for general informational and educational purposes only. We do not claim any ownership over, nor do we intend to infringe upon, any trademarks, copyrights, logos, brand names, or other intellectual property mentioned or depicted on this site. Such intellectual property remains the property of its respective owners, and any references here are made solely for identification or informational purposes, without implying any affiliation, endorsement, or partnership.
We make no representations or warranties, express or implied, regarding the accuracy, completeness, or suitability of any content or products presented. Nothing on this website should be construed as legal, tax, investment, financial, medical, or other professional advice. In addition, no part of this site—including articles or product references—constitutes a solicitation, recommendation, endorsement, advertisement, or offer to buy or sell any securities, franchises, or other financial instruments, particularly in jurisdictions where such activity would be unlawful.
All content is of a general nature and may not address the specific circumstances of any individual or entity. It is not a substitute for professional advice or services. Any actions you take based on the information provided here are strictly at your own risk. You accept full responsibility for any decisions or outcomes arising from your use of this website and agree to release us from any liability in connection with your use of, or reliance upon, the content or products found herein.