
|
Sony Group Corporation (Sony) DCF تقييم |
Fully Editable: Tailor To Your Needs In Excel Or Sheets
Professional Design: Trusted, Industry-Standard Templates
Investor-Approved Valuation Models
MAC/PC Compatible, Fully Unlocked
No Expertise Is Needed; Easy To Follow
Sony Group Corporation (SONY) Bundle
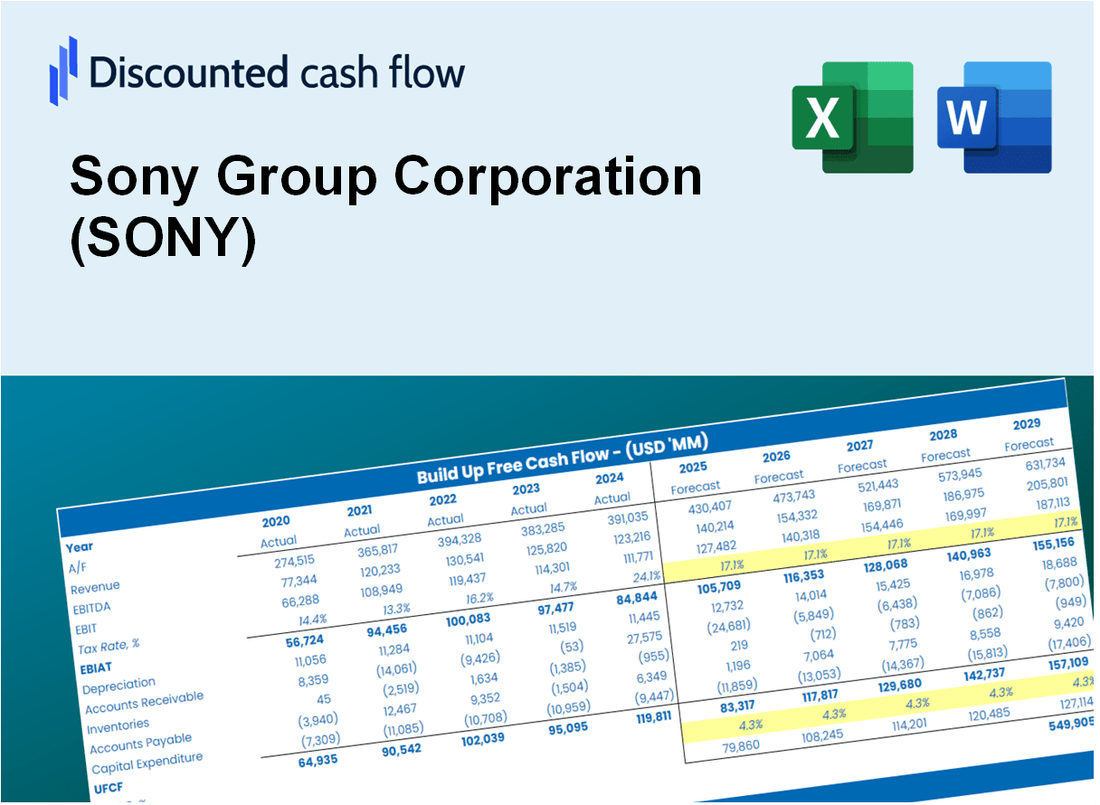
تم تصميم حاسبة DCF الخاصة بنا (Sony) DCF ، المصممة من أجل الدقة ، من تقييم تقييم Sony Group Corporation باستخدام البيانات المالية في العالم الحقيقي ، مما يوفر مرونة كاملة لتعديل جميع المعلمات الرئيسية للتوقعات المحسنة.
What You Will Get
- Real SONY Financial Data: Pre-filled with Sony’s historical and projected data for precise analysis.
- Fully Editable Template: Modify key inputs like revenue growth, WACC, and EBITDA % with ease.
- Automatic Calculations: See Sony’s intrinsic value update instantly based on your changes.
- Professional Valuation Tool: Designed for investors, analysts, and consultants seeking accurate DCF results.
- User-Friendly Design: Simple structure and clear instructions for all experience levels.
Key Features
- Comprehensive DCF Calculator: Offers detailed unlevered and levered DCF valuation models tailored for Sony Group Corporation (SONY).
- WACC Calculator: Features a pre-built Weighted Average Cost of Capital sheet with adjustable inputs specific to Sony.
- Customizable Forecast Assumptions: Easily adjust growth rates, capital expenditures, and discount rates to fit your analysis.
- Integrated Financial Ratios: Assess profitability, leverage, and efficiency ratios relevant to Sony Group Corporation (SONY).
- Interactive Dashboard and Charts: Visual representations highlight key valuation metrics for straightforward analysis.
How It Works
- 1. Access the Template: Download and open the Excel file featuring Sony Group Corporation’s preloaded data.
- 2. Modify Assumptions: Adjust key variables such as growth rates, WACC, and capital expenditures.
- 3. View Results Instantly: The DCF model automatically computes intrinsic value and NPV.
- 4. Explore Scenarios: Analyze various forecasts to evaluate different valuation results.
- 5. Present with Confidence: Deliver professional valuation insights to bolster your decision-making.
Why Choose This Calculator for Sony Group Corporation (SONY)?
- User-Friendly Interface: Crafted for both novices and seasoned users.
- Customizable Inputs: Modify parameters easily to suit your financial analysis.
- Real-Time Valuation: Observe immediate updates to Sony's valuation as you change inputs.
- Pre-Loaded Data: Comes with Sony's actual financial figures for swift evaluations.
- Relied Upon by Experts: Favored by investors and analysts for making sound investment choices.
Who Should Use This Product?
- Investors: Assess Sony's valuation before making stock transactions.
- CFOs and Financial Analysts: Optimize valuation workflows and evaluate financial forecasts.
- Startup Founders: Understand the valuation methods used for leading companies like Sony.
- Consultants: Create comprehensive valuation reports for their clients.
- Students and Educators: Utilize real-life data to learn and teach valuation methodologies.
What the Template Contains
- Pre-Filled DCF Model: Sony’s financial data preloaded for immediate use.
- WACC Calculator: Detailed calculations for Weighted Average Cost of Capital.
- Financial Ratios: Evaluate Sony’s profitability, leverage, and efficiency.
- Editable Inputs: Change assumptions such as growth, margins, and CAPEX to fit your scenarios.
- Financial Statements: Annual and quarterly reports to support detailed analysis.
- Interactive Dashboard: Easily visualize key valuation metrics and results.
Disclaimer
All information, articles, and product details provided on this website are for general informational and educational purposes only. We do not claim any ownership over, nor do we intend to infringe upon, any trademarks, copyrights, logos, brand names, or other intellectual property mentioned or depicted on this site. Such intellectual property remains the property of its respective owners, and any references here are made solely for identification or informational purposes, without implying any affiliation, endorsement, or partnership.
We make no representations or warranties, express or implied, regarding the accuracy, completeness, or suitability of any content or products presented. Nothing on this website should be construed as legal, tax, investment, financial, medical, or other professional advice. In addition, no part of this site—including articles or product references—constitutes a solicitation, recommendation, endorsement, advertisement, or offer to buy or sell any securities, franchises, or other financial instruments, particularly in jurisdictions where such activity would be unlawful.
All content is of a general nature and may not address the specific circumstances of any individual or entity. It is not a substitute for professional advice or services. Any actions you take based on the information provided here are strictly at your own risk. You accept full responsibility for any decisions or outcomes arising from your use of this website and agree to release us from any liability in connection with your use of, or reliance upon, the content or products found herein.