
|
Suzano S.A (SUZ) DCF تقييم |
Fully Editable: Tailor To Your Needs In Excel Or Sheets
Professional Design: Trusted, Industry-Standard Templates
Investor-Approved Valuation Models
MAC/PC Compatible, Fully Unlocked
No Expertise Is Needed; Easy To Follow
Suzano S.A. (SUZ) Bundle
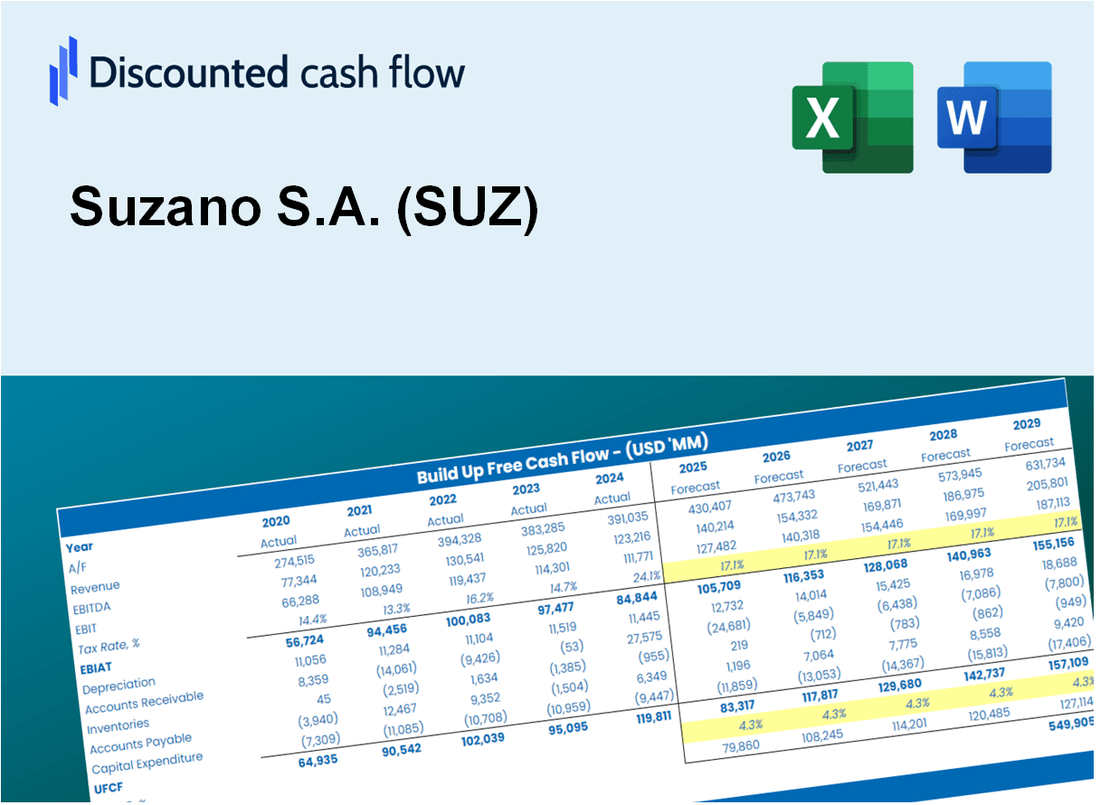
اكتساب رؤى حول تحليل تقييم سوزانو س. مزودًا ببيانات SUZ الحقيقية ، يمكّنك هذا القالب Excel من ضبط التوقعات والافتراضات لتحديد القيمة الجوهرية لسوزانو S.A (SUZ) بدقة.
Discounted Cash Flow (DCF) - (USD MM)
| Year | AY1 2020 |
AY2 2021 |
AY3 2022 |
AY4 2023 |
AY5 2024 |
FY1 2025 |
FY2 2026 |
FY3 2027 |
FY4 2028 |
FY5 2029 |
|---|---|---|---|---|---|---|---|---|---|---|
| Revenue | 5,750.9 | 7,734.2 | 9,408.0 | 7,505.8 | 8,949.7 | 10,183.6 | 11,587.6 | 13,185.1 | 15,002.9 | 17,071.4 |
| Revenue Growth, % | 0 | 34.49 | 21.64 | -20.22 | 19.24 | 13.79 | 13.79 | 13.79 | 13.79 | 13.79 |
| EBITDA | -1,345.8 | 3,712.7 | 7,585.1 | 5,550.1 | 4,429.3 | 4,657.2 | 5,299.3 | 6,029.9 | 6,861.2 | 7,807.1 |
| EBITDA, % | -23.4 | 48 | 80.62 | 73.94 | 49.49 | 45.73 | 45.73 | 45.73 | 45.73 | 45.73 |
| Depreciation | 1,274.8 | 1,337.2 | 1,404.3 | 1,382.2 | 1,675.6 | 1,864.0 | 2,121.0 | 2,413.4 | 2,746.2 | 3,124.8 |
| Depreciation, % | 22.17 | 17.29 | 14.93 | 18.42 | 18.72 | 18.3 | 18.3 | 18.3 | 18.3 | 18.3 |
| EBIT | -2,620.6 | 2,375.5 | 6,180.8 | 4,167.8 | 2,753.7 | 2,793.2 | 3,178.2 | 3,616.4 | 4,115.0 | 4,682.3 |
| EBIT, % | -45.57 | 30.71 | 65.7 | 55.53 | 30.77 | 27.43 | 27.43 | 27.43 | 27.43 | 27.43 |
| Total Cash | 1,708.1 | 3,983.5 | 3,219.5 | 3,996.8 | 4,151.8 | 4,380.3 | 4,984.2 | 5,671.4 | 6,453.3 | 7,343.0 |
| Total Cash, percent | .0 | .0 | .0 | .0 | .0 | .0 | .0 | .0 | .0 | .0 |
| Account Receivables | 628.6 | 1,302.5 | 1,918.9 | 1,460.7 | 1,933.8 | 1,817.5 | 2,068.1 | 2,353.2 | 2,677.6 | 3,046.8 |
| Account Receivables, % | 10.93 | 16.84 | 20.4 | 19.46 | 21.61 | 17.85 | 17.85 | 17.85 | 17.85 | 17.85 |
| Inventories | 757.0 | 875.6 | 1,081.5 | 1,122.8 | 1,503.3 | 1,379.6 | 1,569.7 | 1,786.2 | 2,032.4 | 2,312.6 |
| Inventories, % | 13.16 | 11.32 | 11.5 | 14.96 | 16.8 | 13.55 | 13.55 | 13.55 | 13.55 | 13.55 |
| Accounts Payable | 445.8 | 620.9 | 1,171.8 | 1,052.0 | 1,139.1 | 1,119.8 | 1,274.1 | 1,449.8 | 1,649.7 | 1,877.1 |
| Accounts Payable, % | 7.75 | 8.03 | 12.46 | 14.02 | 12.73 | 11 | 11 | 11 | 11 | 11 |
| Capital Expenditure | -924.7 | -1,178.8 | -2,801.6 | -3,314.8 | -3,121.4 | -2,854.2 | -3,247.7 | -3,695.5 | -4,205.0 | -4,784.7 |
| Capital Expenditure, % | -16.08 | -15.24 | -29.78 | -44.16 | -34.88 | -28.03 | -28.03 | -28.03 | -28.03 | -28.03 |
| Tax Rate, % | 46.04 | 46.04 | 46.04 | 46.04 | 46.04 | 46.04 | 46.04 | 46.04 | 46.04 | 46.04 |
| EBITAT | -1,593.1 | 2,320.0 | 5,043.3 | 3,261.8 | 1,485.8 | 2,079.6 | 2,366.3 | 2,692.5 | 3,063.7 | 3,486.1 |
| Depreciation | ||||||||||
| Changes in Account Receivables | ||||||||||
| Changes in Inventories | ||||||||||
| Changes in Accounts Payable | ||||||||||
| Capital Expenditure | ||||||||||
| UFCF | -2,182.8 | 1,861.2 | 3,374.4 | 1,626.4 | -726.5 | 1,310.1 | 953.2 | 1,084.6 | 1,234.1 | 1,404.3 |
| WACC, % | 3.44 | 4.51 | 4.04 | 3.95 | 3.24 | 3.84 | 3.84 | 3.84 | 3.84 | 3.84 |
| PV UFCF | ||||||||||
| SUM PV UFCF | 5,339.5 | |||||||||
| Long Term Growth Rate, % | 2.00 | |||||||||
| Free cash flow (T + 1) | 1,432 | |||||||||
| Terminal Value | 78,028 | |||||||||
| Present Terminal Value | 64,642 | |||||||||
| Enterprise Value | 69,982 | |||||||||
| Net Debt | 18,765 | |||||||||
| Equity Value | 51,217 | |||||||||
| Diluted Shares Outstanding, MM | 1,265 | |||||||||
| Equity Value Per Share | 40.49 |
What You Will Receive
- Authentic SUZ Financial Data: Pre-loaded with Suzano’s historical and projected figures for precise evaluations.
- Completely Customizable Template: Effortlessly adjust key metrics such as revenue growth, WACC, and EBITDA %.
- Instant Calculations: Watch Suzano’s intrinsic value refresh in real-time as you make adjustments.
- Expert Valuation Tool: Tailored for investors, analysts, and consultants aiming for reliable DCF outcomes.
- Intuitive Design: Clear layout and straightforward instructions suitable for all skill levels.
Key Features
- 🔍 Real-Life SUZ Financials: Pre-filled historical and projected data for Suzano S.A.
- ✏️ Fully Customizable Inputs: Adjust all critical parameters (yellow cells) like WACC, growth %, and tax rates.
- 📊 Professional DCF Valuation: Built-in formulas calculate Suzano’s intrinsic value using the Discounted Cash Flow method.
- ⚡ Instant Results: Visualize Suzano’s valuation instantly after making changes.
- Scenario Analysis: Test and compare outcomes for various financial assumptions side-by-side.
How It Works
- 1. Access the Template: Download and open the Excel file containing Suzano S.A.'s (SUZ) preloaded data.
- 2. Adjust Assumptions: Modify key inputs such as growth rates, WACC, and capital expenditures to fit your analysis.
- 3. Observe Results Instantly: The DCF model automatically computes the intrinsic value and NPV based on your inputs.
- 4. Explore Scenarios: Evaluate various forecasts to understand different valuation possibilities.
- 5. Present with Assurance: Share professional valuation insights to bolster your decision-making process.
Why Choose This Calculator for Suzano S.A. (SUZ)?
- User-Friendly Interface: Perfect for both novices and seasoned professionals.
- Customizable Inputs: Adjust parameters easily to suit your financial analysis.
- Real-Time Adjustments: Watch Suzano’s valuation change instantly as you modify inputs.
- Pre-Loaded Data: Comes with Suzano’s current financial metrics for swift evaluations.
- Relied Upon by Experts: Favored by investors and analysts for sound decision-making.
Who Should Use Suzano S.A. (SUZ)?
- Investors: Gain insights into the forestry and paper industry with a robust analysis tool.
- Financial Analysts: Streamline your research with a comprehensive financial model tailored for Suzano S.A. (SUZ).
- Consultants: Easily modify the template for client briefs and strategic presentations.
- Finance Enthusiasts: Enhance your knowledge of the market dynamics affecting Suzano S.A. (SUZ) through relevant case studies.
- Educators and Students: Utilize it as a hands-on resource for courses focused on corporate finance and sustainability.
What the Template Contains
- Comprehensive DCF Model: Editable template with detailed valuation calculations tailored for Suzano S.A. (SUZ).
- Real-World Data: Suzano's historical and projected financials preloaded for thorough analysis.
- Customizable Parameters: Adjust WACC, growth rates, and tax assumptions to explore various scenarios.
- Financial Statements: Complete annual and quarterly breakdowns providing deeper insights into performance.
- Key Ratios: Integrated analysis for profitability, efficiency, and leverage metrics.
- Dashboard with Visual Outputs: Charts and tables designed for clear, actionable insights.
Disclaimer
All information, articles, and product details provided on this website are for general informational and educational purposes only. We do not claim any ownership over, nor do we intend to infringe upon, any trademarks, copyrights, logos, brand names, or other intellectual property mentioned or depicted on this site. Such intellectual property remains the property of its respective owners, and any references here are made solely for identification or informational purposes, without implying any affiliation, endorsement, or partnership.
We make no representations or warranties, express or implied, regarding the accuracy, completeness, or suitability of any content or products presented. Nothing on this website should be construed as legal, tax, investment, financial, medical, or other professional advice. In addition, no part of this site—including articles or product references—constitutes a solicitation, recommendation, endorsement, advertisement, or offer to buy or sell any securities, franchises, or other financial instruments, particularly in jurisdictions where such activity would be unlawful.
All content is of a general nature and may not address the specific circumstances of any individual or entity. It is not a substitute for professional advice or services. Any actions you take based on the information provided here are strictly at your own risk. You accept full responsibility for any decisions or outcomes arising from your use of this website and agree to release us from any liability in connection with your use of, or reliance upon, the content or products found herein.