
|
شركة Savara Inc. (SVRA) DCF |
Fully Editable: Tailor To Your Needs In Excel Or Sheets
Professional Design: Trusted, Industry-Standard Templates
Investor-Approved Valuation Models
MAC/PC Compatible, Fully Unlocked
No Expertise Is Needed; Easy To Follow
Savara Inc. (SVRA) Bundle
تُمكّنك حاسبة DCF الخاصة بنا (SVRA) DCF من تقييم تقييم Savara Inc. باستخدام البيانات المالية في العالم الحقيقي ، مما يوفر مرونة كاملة لتعديل جميع المعلمات الرئيسية للتوقعات المحسنة.
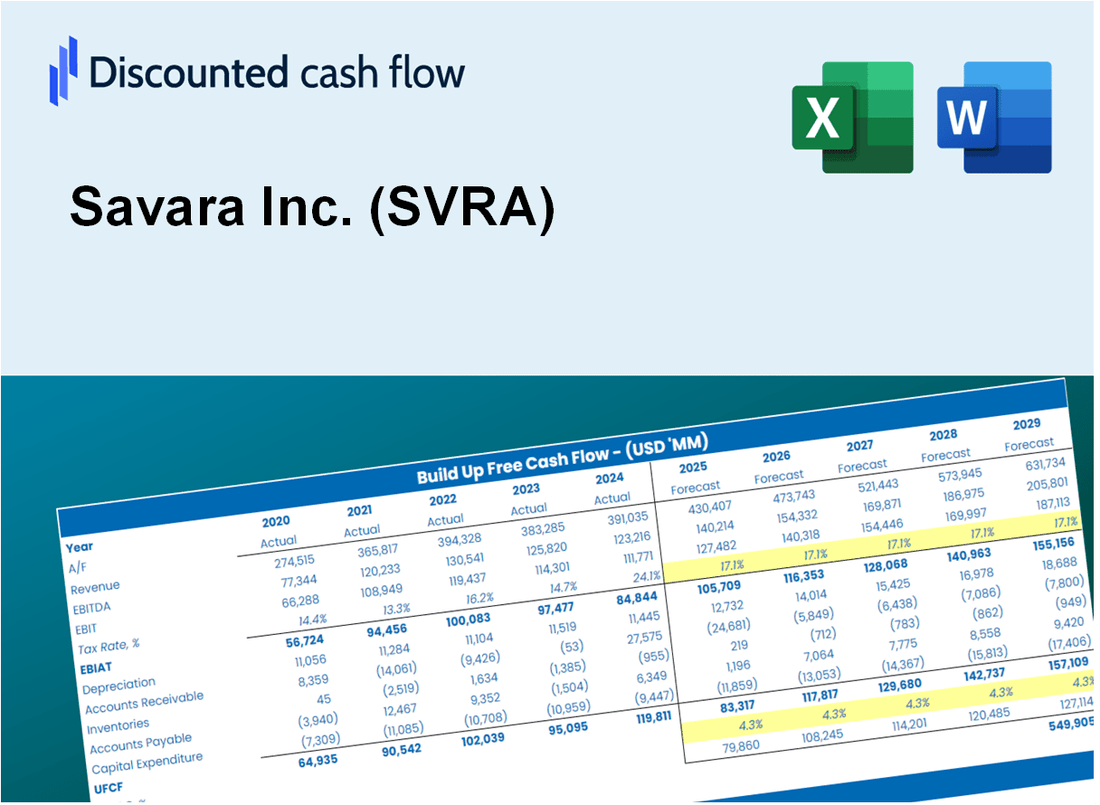
Discounted Cash Flow (DCF) - (USD MM)
| Year | AY1 2020 |
AY2 2021 |
AY3 2022 |
AY4 2023 |
AY5 2024 |
FY1 2025 |
FY2 2026 |
FY3 2027 |
FY4 2028 |
FY5 2029 |
|---|---|---|---|---|---|---|---|---|---|---|
| Revenue | .3 | .0 | .0 | .0 | .0 | .0 | .0 | .0 | .0 | .0 |
| Revenue Growth, % | 0 | -100 | 0 | 0 | 0 | -25 | -25 | -25 | -25 | -25 |
| EBITDA | -45.9 | -40.5 | -38.0 | -59.1 | -102.3 | .0 | .0 | .0 | .0 | .0 |
| EBITDA, % | -17841.25 | 100 | 100 | 100 | 100 | 60 | 60 | 60 | 60 | 60 |
| Depreciation | .3 | .1 | .0 | .1 | .1 | .0 | .0 | .0 | .0 | .0 |
| Depreciation, % | 99.22 | 100 | 100 | 100 | 100 | 99.84 | 99.84 | 99.84 | 99.84 | 99.84 |
| EBIT | -46.1 | -40.6 | -38.0 | -59.2 | -102.4 | .0 | .0 | .0 | .0 | .0 |
| EBIT, % | -17940.47 | 100 | 100 | 100 | 100 | 60 | 60 | 60 | 60 | 60 |
| Total Cash | 82.2 | 161.2 | 125.9 | 162.3 | 196.3 | .0 | .0 | .0 | .0 | .0 |
| Total Cash, percent | .0 | .0 | .0 | .0 | .0 | .0 | .0 | .0 | .0 | .0 |
| Account Receivables | 1.7 | 1.1 | 1.0 | 1.0 | 1.0 | .0 | .0 | .0 | .0 | .0 |
| Account Receivables, % | 659.53 | 100 | 100 | 100 | 100 | 100 | 100 | 100 | 100 | 100 |
| Inventories | .0 | -1.1 | 2.1 | .0 | .0 | .0 | .0 | .0 | .0 | .0 |
| Inventories, % | 0 | 100 | 100 | 100 | 100 | 80 | 80 | 80 | 80 | 80 |
| Accounts Payable | 2.6 | 1.4 | 1.3 | 3.5 | 4.5 | .0 | .0 | .0 | .0 | .0 |
| Accounts Payable, % | 1009.73 | 100 | 100 | 100 | 100 | 100 | 100 | 100 | 100 | 100 |
| Capital Expenditure | -3.3 | -.1 | .0 | -.3 | .0 | .0 | .0 | .0 | .0 | .0 |
| Capital Expenditure, % | -1281.71 | 100 | 100 | 100 | 100 | -20 | -20 | -20 | -20 | -20 |
| Tax Rate, % | 0 | 0 | 0 | 0 | 0 | 0 | 0 | 0 | 0 | 0 |
| EBITAT | -46.1 | -40.6 | -38.0 | -59.2 | -102.4 | .0 | .0 | .0 | .0 | .0 |
| Depreciation | ||||||||||
| Changes in Account Receivables | ||||||||||
| Changes in Inventories | ||||||||||
| Changes in Accounts Payable | ||||||||||
| Capital Expenditure | ||||||||||
| UFCF | -48.2 | -40.0 | -41.1 | -55.3 | -101.3 | -3.5 | .0 | .0 | .0 | .0 |
| WACC, % | 4.97 | 4.97 | 4.97 | 4.97 | 4.97 | 4.97 | 4.97 | 4.97 | 4.97 | 4.97 |
| PV UFCF | ||||||||||
| SUM PV UFCF | -3.3 | |||||||||
| Long Term Growth Rate, % | 2.00 | |||||||||
| Free cash flow (T + 1) | 0 | |||||||||
| Terminal Value | 0 | |||||||||
| Present Terminal Value | 0 | |||||||||
| Enterprise Value | -3 | |||||||||
| Net Debt | 12 | |||||||||
| Equity Value | -15 | |||||||||
| Diluted Shares Outstanding, MM | 198 | |||||||||
| Equity Value Per Share | -0.08 |
What You Will Get
- Real SVRA Financials: Access historical and projected data for precise valuation.
- Customizable Inputs: Adjust WACC, tax rates, revenue growth, and capital expenditures as needed.
- Dynamic Calculations: Intrinsic value and NPV are computed automatically.
- Scenario Analysis: Explore various scenarios to assess Savara Inc.'s future performance.
- User-Friendly Design: Designed for professionals while remaining approachable for newcomers.
Key Features
- Comprehensive SVRA Data: Pre-filled with Savara Inc.’s historical performance metrics and future outlooks.
- Fully Customizable Inputs: Modify revenue growth rates, profit margins, discount rates, tax implications, and capital investments.
- Adaptive Valuation Model: Instant updates to Net Present Value (NPV) and intrinsic value based on your adjustments.
- Scenario Analysis: Develop various forecast scenarios to evaluate different valuation results.
- User-Friendly Interface: Intuitive, organized, and tailored for both industry professionals and newcomers.
How It Works
- Step 1: Download the Excel file.
- Step 2: Review pre-entered Savara Inc. (SVRA) data (historical and projected).
- Step 3: Adjust key assumptions (yellow cells) based on your analysis.
- Step 4: View automatic recalculations for Savara Inc.'s intrinsic value.
- Step 5: Use the outputs for investment decisions or reporting.
Why Choose Savara Inc. (SVRA)?
- Save Time: Quickly access comprehensive data without the hassle of building from the ground up.
- Enhance Accuracy: Dependable financial metrics and methodologies minimize valuation errors.
- Fully Customizable: Adjust the model to align with your specific assumptions and forecasts.
- Simple to Analyze: Intuitive graphs and outputs facilitate straightforward interpretation of results.
- Endorsed by Professionals: Crafted for experts who prioritize both precision and functionality.
Who Should Use Savara Inc. (SVRA)?
- Investors: Gain insights into the biopharmaceutical sector with a reliable investment analysis tool.
- Financial Analysts: Streamline your workflow with customizable financial models tailored for Savara Inc. (SVRA).
- Consultants: Efficiently modify the framework for client presentations or strategic reports on Savara Inc. (SVRA).
- Biotech Enthusiasts: Enhance your knowledge of the industry through detailed case studies and market analysis.
- Educators and Students: Utilize it as a hands-on resource in courses focused on biotechnology and finance.
What the Template Contains
- Pre-Filled Data: Includes Savara Inc.’s historical financials and forecasts.
- Discounted Cash Flow Model: Editable DCF valuation model with automatic calculations.
- Weighted Average Cost of Capital (WACC): A dedicated sheet for calculating WACC based on custom inputs.
- Key Financial Ratios: Analyze Savara Inc.’s profitability, efficiency, and leverage.
- Customizable Inputs: Edit revenue growth, margins, and tax rates with ease.
- Clear Dashboard: Charts and tables summarizing key valuation results.
Disclaimer
All information, articles, and product details provided on this website are for general informational and educational purposes only. We do not claim any ownership over, nor do we intend to infringe upon, any trademarks, copyrights, logos, brand names, or other intellectual property mentioned or depicted on this site. Such intellectual property remains the property of its respective owners, and any references here are made solely for identification or informational purposes, without implying any affiliation, endorsement, or partnership.
We make no representations or warranties, express or implied, regarding the accuracy, completeness, or suitability of any content or products presented. Nothing on this website should be construed as legal, tax, investment, financial, medical, or other professional advice. In addition, no part of this site—including articles or product references—constitutes a solicitation, recommendation, endorsement, advertisement, or offer to buy or sell any securities, franchises, or other financial instruments, particularly in jurisdictions where such activity would be unlawful.
All content is of a general nature and may not address the specific circumstances of any individual or entity. It is not a substitute for professional advice or services. Any actions you take based on the information provided here are strictly at your own risk. You accept full responsibility for any decisions or outcomes arising from your use of this website and agree to release us from any liability in connection with your use of, or reliance upon, the content or products found herein.