
|
Taylor Devices ، Inc. (TAYD) DCF تقييم |
Fully Editable: Tailor To Your Needs In Excel Or Sheets
Professional Design: Trusted, Industry-Standard Templates
Investor-Approved Valuation Models
MAC/PC Compatible, Fully Unlocked
No Expertise Is Needed; Easy To Follow
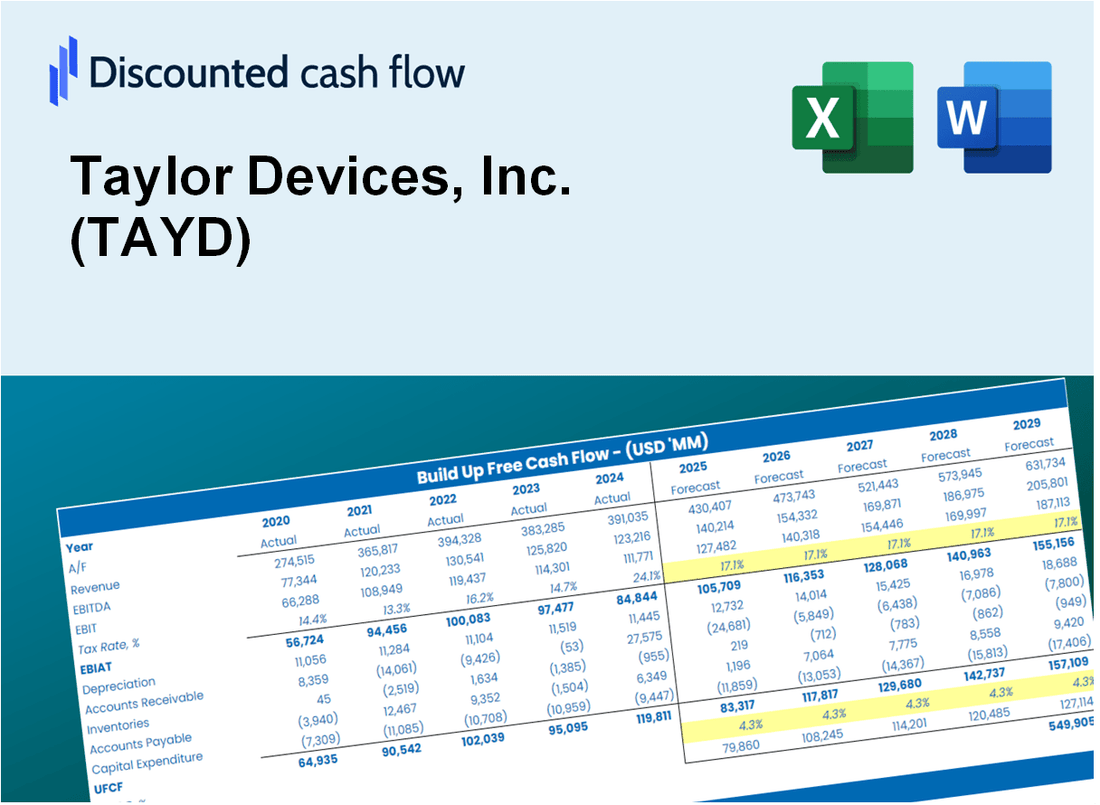
Taylor Devices, Inc. (TAYD) Bundle
تقييم المستقبل المالي لشركة Taylor Devices ، Inc. مثل خبير! توفر حاسبة DCF (TAYD) هذه الماليات المملوءة مسبقًا والمرونة الكاملة لتعديل نمو الإيرادات ، WACC ، الهوامش ، وغيرها من الافتراضات الأساسية التي تتماشى مع توقعاتك.
What You Will Gain
- Adjustable Forecast Inputs: Effortlessly modify key assumptions (growth %, margins, WACC) to explore various scenarios.
- Comprehensive Data: Taylor Devices, Inc.'s (TAYD) financial information pre-loaded to enhance your analysis.
- Automated DCF Calculations: The template provides Net Present Value (NPV) and intrinsic value calculations automatically.
- Tailored and Professional: A refined Excel model designed to meet your valuation requirements.
- Designed for Analysts and Investors: Perfect for evaluating projections, confirming strategies, and optimizing efficiency.
Key Features
- Comprehensive TAYD Data: Pre-filled with Taylor Devices' historical performance metrics and future growth estimates.
- Customizable Assumptions: Modify revenue growth rates, profit margins, discount rates, tax percentages, and capital investment plans.
- Adaptive Valuation Framework: Instant updates to Net Present Value (NPV) and intrinsic value based on your specified parameters.
- Scenario Analysis: Develop various forecasting scenarios to evaluate different valuation possibilities.
- Intuitive Interface: Clean, organized design suitable for both industry experts and novices.
How It Works
- Download the Template: Gain immediate access to the Excel-based TAYD DCF Calculator.
- Input Your Assumptions: Modify the yellow-highlighted cells for growth rates, WACC, margins, and other variables.
- Instant Calculations: The model automatically calculates the intrinsic value of Taylor Devices, Inc. (TAYD).
- Test Scenarios: Experiment with various assumptions to assess potential changes in valuation.
- Analyze and Decide: Utilize the results to inform your investment or financial analysis.
Why Choose This Calculator for Taylor Devices, Inc. (TAYD)?
- Designed for Experts: A sophisticated tool utilized by engineers, financial analysts, and project managers.
- Accurate Data: Taylor Devices’ historical and projected financials preloaded for precision.
- Versatile Scenario Analysis: Effortlessly test various forecasts and assumptions.
- Comprehensive Outputs: Automatically computes intrinsic value, NPV, and essential metrics.
- User-Friendly: Step-by-step guidance to ensure a smooth experience.
Who Should Use Taylor Devices, Inc. (TAYD)?
- Investors: Gain insights into the performance of a leading manufacturer of shock and vibration control products.
- Financial Analysts: Utilize detailed financial reports to enhance your market analysis.
- Consultants: Leverage industry-specific data for tailored client solutions and recommendations.
- Engineering Professionals: Explore innovative technologies and applications in vibration control systems.
- Students and Educators: Engage with real-world case studies in mechanical engineering and finance courses.
What the Template Contains
- Pre-Filled DCF Model: Taylor Devices, Inc.'s (TAYD) financial data preloaded for immediate use.
- WACC Calculator: Detailed calculations for Weighted Average Cost of Capital.
- Financial Ratios: Evaluate Taylor Devices, Inc.'s (TAYD) profitability, leverage, and efficiency.
- Editable Inputs: Change assumptions such as growth, margins, and CAPEX to fit your scenarios.
- Financial Statements: Annual and quarterly reports to support detailed analysis.
- Interactive Dashboard: Easily visualize key valuation metrics and results.
Disclaimer
All information, articles, and product details provided on this website are for general informational and educational purposes only. We do not claim any ownership over, nor do we intend to infringe upon, any trademarks, copyrights, logos, brand names, or other intellectual property mentioned or depicted on this site. Such intellectual property remains the property of its respective owners, and any references here are made solely for identification or informational purposes, without implying any affiliation, endorsement, or partnership.
We make no representations or warranties, express or implied, regarding the accuracy, completeness, or suitability of any content or products presented. Nothing on this website should be construed as legal, tax, investment, financial, medical, or other professional advice. In addition, no part of this site—including articles or product references—constitutes a solicitation, recommendation, endorsement, advertisement, or offer to buy or sell any securities, franchises, or other financial instruments, particularly in jurisdictions where such activity would be unlawful.
All content is of a general nature and may not address the specific circumstances of any individual or entity. It is not a substitute for professional advice or services. Any actions you take based on the information provided here are strictly at your own risk. You accept full responsibility for any decisions or outcomes arising from your use of this website and agree to release us from any liability in connection with your use of, or reliance upon, the content or products found herein.