
|
Telecom Plus PLC (TEP.L) DCF تقييم |
Fully Editable: Tailor To Your Needs In Excel Or Sheets
Professional Design: Trusted, Industry-Standard Templates
Investor-Approved Valuation Models
MAC/PC Compatible, Fully Unlocked
No Expertise Is Needed; Easy To Follow
Telecom Plus Plc (TEP.L) Bundle
تقييم التوقعات المالية لـ Telecom Plus Plc كخبير! توفر لك حاسبة DCF (TEPL) هذه البيانات المالية المليئة مسبقًا والمرونة لتعديل نمو الإيرادات ، و WACC ، والهوامش ، وغيرها من الافتراضات الأساسية التي تتماشى مع توقعاتك.
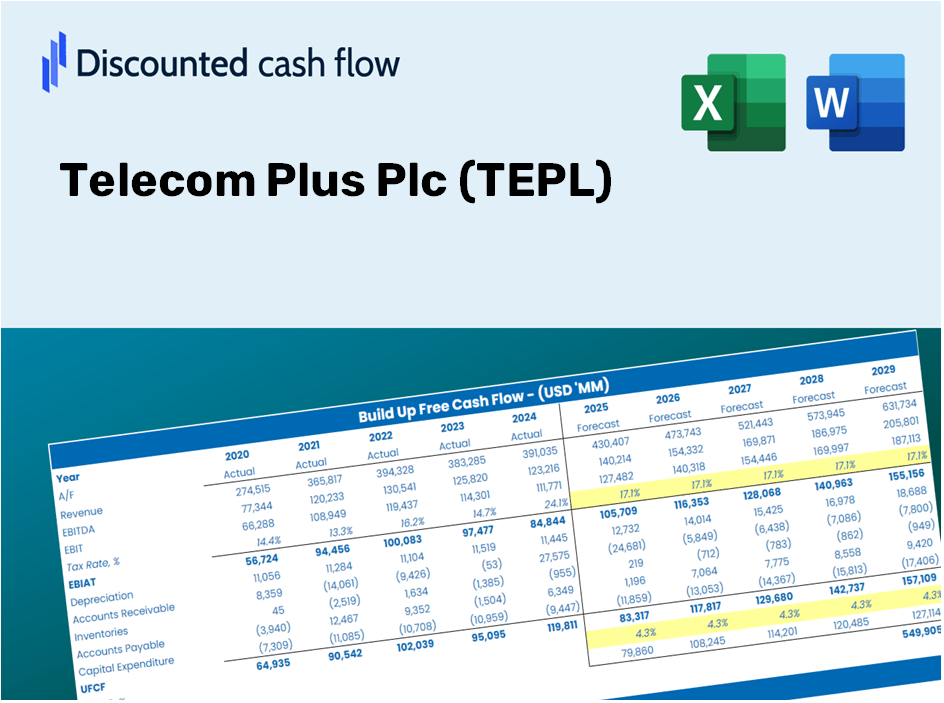
Discounted Cash Flow (DCF) - (USD MM)
| Year | AY1 2020 |
AY2 2021 |
AY3 2022 |
AY4 2023 |
AY5 2024 |
FY1 2025 |
FY2 2026 |
FY3 2027 |
FY4 2028 |
FY5 2029 |
|---|---|---|---|---|---|---|---|---|---|---|
| Revenue | 861.2 | 967.4 | 2,475.2 | 2,039.1 | 1,838.2 | 1,730.5 | 1,629.1 | 1,533.7 | 1,443.9 | 1,359.3 |
| Revenue Growth, % | 0 | 12.33 | 155.85 | -17.62 | -9.86 | -5.86 | -5.86 | -5.86 | -5.86 | -5.86 |
| EBITDA | 65.1 | 70.3 | 106.0 | 131.4 | 142.1 | 115.2 | 108.4 | 102.1 | 96.1 | 90.5 |
| EBITDA, % | 7.56 | 7.26 | 4.28 | 6.44 | 7.73 | 6.66 | 6.66 | 6.66 | 6.66 | 6.66 |
| Depreciation | 19.3 | 20.3 | 21.4 | 21.8 | 23.1 | 26.1 | 24.5 | 23.1 | 21.8 | 20.5 |
| Depreciation, % | 2.24 | 2.1 | 0.86358 | 1.07 | 1.26 | 1.51 | 1.51 | 1.51 | 1.51 | 1.51 |
| EBIT | 45.8 | 49.9 | 84.7 | 109.5 | 119.1 | 89.1 | 83.9 | 79.0 | 74.3 | 70.0 |
| EBIT, % | 5.32 | 5.16 | 3.42 | 5.37 | 6.48 | 5.15 | 5.15 | 5.15 | 5.15 | 5.15 |
| Total Cash | 25.1 | 29.6 | 193.8 | 57.8 | 79.0 | 72.5 | 68.2 | 64.2 | 60.5 | 56.9 |
| Total Cash, percent | .0 | .0 | .0 | .0 | .0 | .0 | .0 | .0 | .0 | .0 |
| Account Receivables | 182.8 | 185.4 | 329.5 | 324.9 | 354.1 | 307.7 | 289.7 | 272.7 | 256.7 | 241.7 |
| Account Receivables, % | 21.23 | 19.16 | 13.31 | 15.93 | 19.26 | 17.78 | 17.78 | 17.78 | 17.78 | 17.78 |
| Inventories | 6.3 | 4.2 | 5.7 | 3.7 | 3.2 | 6.1 | 5.7 | 5.4 | 5.1 | 4.8 |
| Inventories, % | 0.73444 | 0.42918 | 0.23021 | 0.18385 | 0.17409 | 0.35035 | 0.35035 | 0.35035 | 0.35035 | 0.35035 |
| Accounts Payable | 22.9 | 28.6 | 38.8 | 44.6 | 37.2 | 39.5 | 37.2 | 35.0 | 32.9 | 31.0 |
| Accounts Payable, % | 2.66 | 2.96 | 1.57 | 2.19 | 2.02 | 2.28 | 2.28 | 2.28 | 2.28 | 2.28 |
| Capital Expenditure | -10.0 | -9.9 | -11.0 | -12.5 | -17.2 | -14.5 | -13.6 | -12.8 | -12.1 | -11.4 |
| Capital Expenditure, % | -1.17 | -1.03 | -0.44502 | -0.61281 | -0.93371 | -0.837 | -0.837 | -0.837 | -0.837 | -0.837 |
| Tax Rate, % | 28.18 | 28.18 | 28.18 | 28.18 | 28.18 | 28.18 | 28.18 | 28.18 | 28.18 | 28.18 |
| EBITAT | 34.3 | 37.5 | 67.8 | 77.4 | 85.5 | 66.4 | 62.5 | 58.8 | 55.4 | 52.2 |
| Depreciation | ||||||||||
| Changes in Account Receivables | ||||||||||
| Changes in Inventories | ||||||||||
| Changes in Accounts Payable | ||||||||||
| Capital Expenditure | ||||||||||
| UFCF | -122.7 | 53.2 | -57.4 | 99.1 | 55.3 | 123.8 | 89.5 | 84.2 | 79.3 | 74.7 |
| WACC, % | 6.13 | 6.13 | 6.18 | 6.1 | 6.11 | 6.13 | 6.13 | 6.13 | 6.13 | 6.13 |
| PV UFCF | ||||||||||
| SUM PV UFCF | 384.5 | |||||||||
| Long Term Growth Rate, % | 3.00 | |||||||||
| Free cash flow (T + 1) | 77 | |||||||||
| Terminal Value | 2,457 | |||||||||
| Present Terminal Value | 1,825 | |||||||||
| Enterprise Value | 2,210 | |||||||||
| Net Debt | 116 | |||||||||
| Equity Value | 2,094 | |||||||||
| Diluted Shares Outstanding, MM | 80 | |||||||||
| Equity Value Per Share | 2,615.75 |
الفوائد التي ستتلقاها
- النموذج المالي المليء مسبقًا: استخدم بيانات Telecom Plus الفعلية لـ PLC لتقييمات DCF دقيقة.
- السيطرة الشاملة على التنبؤ: تعديل نمو الإيرادات ، هوامش الربح ، WACC ، وغيرها من العوامل الأساسية.
- الحسابات في الوقت الحقيقي: التحديثات الفورية لعرض النتائج أثناء تنفيذ التغييرات.
- قالب من الدرجة المهنية: ملف Excel المصقول مصنوعًا لتحليل التقييم الأعلى.
- مرنة وقابلة لإعادة الاستخدام: مصمم للتكيف ، والسماح للاستخدام المتكرر في التوقعات التفصيلية.
الميزات الرئيسية
- البيانات التي تم تحميلها مسبقًا: بيانات Telecom Plus Plc التاريخية والتنبؤات المليئة مسبقًا.
- مدخلات قابلة للتعديل بالكامل: تخصيص WACC ، ومعدلات الضرائب ، ونمو الإيرادات ، وهامش EBITDA حسب الحاجة.
- النتائج الفورية: شاهد تحديث القيمة الجوهرية لـ PLC Plc في الوقت الفعلي.
- واضحة المخرجات المرئية: توضح مخططات لوحة القيادة نتائج التقييم والمقاييس الأساسية.
- بنيت للدقة: أداة من الدرجة المهنية المصممة للمحللين والمستثمرين والمهنيين الماليين.
كيف تعمل
- الخطوة 1: قم بتنزيل قالب Excel Prebuilt الذي يضم بيانات Telecom Plus PLC (TEPL).
- الخطوة 2: انتقل عبر الأوراق المملوءة مسبقًا للتعرف على المقاييس الأساسية.
- الخطوة 3: تعديل التوقعات والافتراضات في الخلايا الصفراء القابلة للتحرير (WACC ، النمو ، الهوامش).
- الخطوة 4: انظر على الفور النتائج المعاد حسابها ، بما في ذلك القيمة الجوهرية للاتصالات PLC (TEPL).
- الخطوة 5: استخدم المخرجات لاتخاذ قرارات استثمار مستنيرة أو إنشاء تقارير مفصلة.
لماذا تختار هذه الآلة الحاسبة؟
- مصمم للخبراء: أداة متطورة يستخدمها المحللون والمدير المالي والمستشارون في هذا المجال.
- بيانات دقيقة: يتم تحميل المعلومات المالية والتاريخية والمتوقعة في Telecom Plus Plc (TEPL) للدقة.
- تحليل السيناريو: اختبار دون عناء التنبؤات والافتراضات.
- نتائج واضحة: يحدد تلقائيًا القيمة الجوهرية ، NPV ، والمقاييس الأساسية.
- سهل الاستخدام: يضمن التوجيه خطوة بخطوة تجربة سلسة طوال العملية.
من يمكنه الاستفادة من Telecom Plus PLC (TEPL)؟
- المستثمرون: اتخاذ خيارات مستنيرة من خلال أداة التقييم المتقدمة الخاصة بنا المصممة خصيصًا لـ Telecom Plus PLC (TEPL).
- المحللون الماليون: قم بتبسيط سير العمل الخاص بك باستخدام نموذج DCF قابل للتخصيص مصمم خصيصًا لاتصالات الاتصالات بالإضافة إلى PLC (TEPL).
- الاستشاريون: قم بتعديل قالبنا للعروض التقديمية الفعالة للعميل أو تقارير مفصلة عن Telecom Plus PLC (TEPL).
- عشاق المالية: عزز معرفتك بمنهجيات التقييم من خلال أمثلة عملية ذات صلة بالاتصالات بالإضافة إلى PLC (TEPL).
- المعلمون والطلاب: استخدم هذا المورد كأداة تعليمية عملية في دورات التمويل التي تركز على Telecom Plus PLC (TEPL).
Overview من ميزات القالب
- نموذج DCF المليء مسبقًا: تم تحميل بيانات Telecom Plus Plc (TEPL) قبل التحليل الفوري.
- حاسبة WACC: حسابات شاملة لمتوسط تكلفة رأس المال المرجح.
- النسب المالية: تقييم ربحية Telecom Plus (TEPL) الربحية والرافعة المالية والكفاءة التشغيلية.
- مدخلات قابلة للتحرير: تخصيص الافتراضات مثل معدلات النمو ، هوامش الربح ، و Capex لتناسب تحليلك.
- البيانات المالية: الوصول إلى كل من التقارير السنوية والفصلية للفحص المتعمق.
- لوحة القيادة التفاعلية: تصور دون عناء مقاييس ونتائج التقييم الأساسية.
Disclaimer
All information, articles, and product details provided on this website are for general informational and educational purposes only. We do not claim any ownership over, nor do we intend to infringe upon, any trademarks, copyrights, logos, brand names, or other intellectual property mentioned or depicted on this site. Such intellectual property remains the property of its respective owners, and any references here are made solely for identification or informational purposes, without implying any affiliation, endorsement, or partnership.
We make no representations or warranties, express or implied, regarding the accuracy, completeness, or suitability of any content or products presented. Nothing on this website should be construed as legal, tax, investment, financial, medical, or other professional advice. In addition, no part of this site—including articles or product references—constitutes a solicitation, recommendation, endorsement, advertisement, or offer to buy or sell any securities, franchises, or other financial instruments, particularly in jurisdictions where such activity would be unlawful.
All content is of a general nature and may not address the specific circumstances of any individual or entity. It is not a substitute for professional advice or services. Any actions you take based on the information provided here are strictly at your own risk. You accept full responsibility for any decisions or outcomes arising from your use of this website and agree to release us from any liability in connection with your use of, or reliance upon, the content or products found herein.