
|
تقييم Truist Financial Corporation (TFC) DCF |
Fully Editable: Tailor To Your Needs In Excel Or Sheets
Professional Design: Trusted, Industry-Standard Templates
Investor-Approved Valuation Models
MAC/PC Compatible, Fully Unlocked
No Expertise Is Needed; Easy To Follow
Truist Financial Corporation (TFC) Bundle
سواء كنت مستثمرًا أو محللًا ، فإن حاسبة [الرمز] (TFC) DCF هي المورد الخاص بك للتقييم الدقيق. يضم بيانات حقيقية من شركة Truist Financial Corporation ، يمكنك بسهولة ضبط التوقعات ومراقبة التأثيرات في الوقت الفعلي.
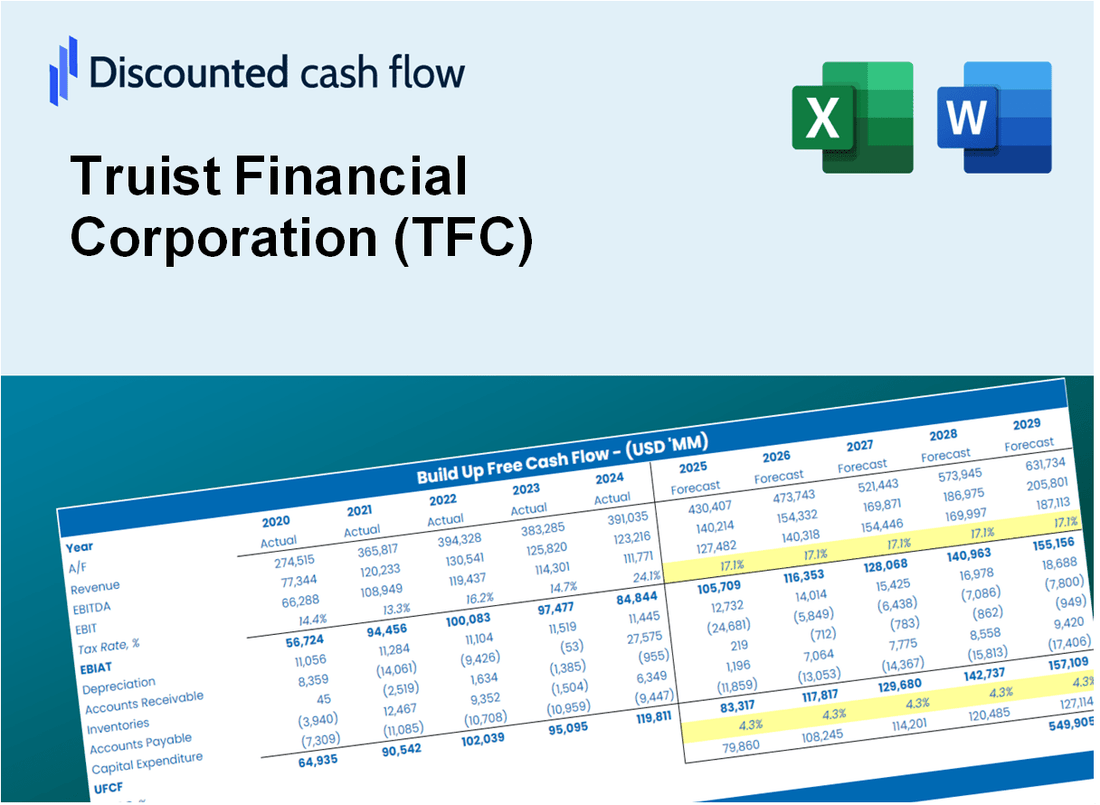
Discounted Cash Flow (DCF) - (USD MM)
| Year | AY1 2020 |
AY2 2021 |
AY3 2022 |
AY4 2023 |
AY5 2024 |
FY1 2025 |
FY2 2026 |
FY3 2027 |
FY4 2028 |
FY5 2029 |
|---|---|---|---|---|---|---|---|---|---|---|
| Revenue | 24,427.0 | 23,064.0 | 22,294.0 | 29,950.0 | 24,253.0 | 24,641.1 | 25,035.4 | 25,436.0 | 25,843.1 | 26,256.6 |
| Revenue Growth, % | 0 | -5.58 | -3.34 | 34.34 | -19.02 | 1.6 | 1.6 | 1.6 | 1.6 | 1.6 |
| EBITDA | 7,081.0 | 9,377.0 | 8,395.0 | 450.0 | 378.0 | 5,438.9 | 5,525.9 | 5,614.3 | 5,704.2 | 5,795.5 |
| EBITDA, % | 28.99 | 40.66 | 37.66 | 1.5 | 1.56 | 22.07 | 22.07 | 22.07 | 22.07 | 22.07 |
| Depreciation | 1,608.0 | 1,384.0 | 1,366.0 | 1,215.0 | 979.0 | 1,321.0 | 1,342.1 | 1,363.6 | 1,385.4 | 1,407.6 |
| Depreciation, % | 6.58 | 6 | 6.13 | 4.06 | 4.04 | 5.36 | 5.36 | 5.36 | 5.36 | 5.36 |
| EBIT | 5,473.0 | 7,993.0 | 7,029.0 | -765.0 | -601.0 | 4,117.9 | 4,183.8 | 4,250.8 | 4,318.8 | 4,387.9 |
| EBIT, % | 22.41 | 34.66 | 31.53 | -2.55 | -2.48 | 16.71 | 16.71 | 16.71 | 16.71 | 16.71 |
| Total Cash | 139,656.0 | 173,418.0 | 93,222.0 | 97,596.0 | 44,323.0 | 24,641.1 | 25,035.4 | 25,436.0 | 25,843.1 | 26,256.6 |
| Total Cash, percent | .0 | .0 | .0 | .0 | .0 | .0 | .0 | .0 | .0 | .0 |
| Account Receivables | 9,452.0 | 10,344.0 | 11,772.0 | 10,980.0 | 13,276.0 | 11,223.9 | 11,403.5 | 11,586.0 | 11,771.4 | 11,959.8 |
| Account Receivables, % | 38.69 | 44.85 | 52.8 | 36.66 | 54.74 | 45.55 | 45.55 | 45.55 | 45.55 | 45.55 |
| Inventories | .0 | .0 | .0 | .0 | .0 | .0 | .0 | .0 | .0 | .0 |
| Inventories, % | 0 | 0 | 0 | 0 | 0 | 0 | 0 | 0 | 0 | 0 |
| Accounts Payable | .0 | .0 | .0 | .0 | .0 | .0 | .0 | .0 | .0 | .0 |
| Accounts Payable, % | 0 | 0 | 0 | 0 | 0 | 0 | 0 | 0 | 0 | 0 |
| Capital Expenditure | -815.0 | -442.0 | -564.0 | .0 | .0 | -383.5 | -389.7 | -395.9 | -402.3 | -408.7 |
| Capital Expenditure, % | -3.34 | -1.92 | -2.53 | 0 | 0 | -1.56 | -1.56 | -1.56 | -1.56 | -1.56 |
| Tax Rate, % | 901.66 | 901.66 | 901.66 | 901.66 | 901.66 | 901.66 | 901.66 | 901.66 | 901.66 | 901.66 |
| EBITAT | 4,482.0 | 6,440.0 | 6,260.0 | -1,091.0 | 4,818.0 | 2,895.1 | 2,941.4 | 2,988.5 | 3,036.3 | 3,084.9 |
| Depreciation | ||||||||||
| Changes in Account Receivables | ||||||||||
| Changes in Inventories | ||||||||||
| Changes in Accounts Payable | ||||||||||
| Capital Expenditure | ||||||||||
| UFCF | -4,177.0 | 6,490.0 | 5,634.0 | 916.0 | 3,501.0 | 5,884.6 | 3,714.2 | 3,773.7 | 3,834.0 | 3,895.4 |
| WACC, % | 11.25 | 11.13 | 11.89 | 12.88 | 3.88 | 10.2 | 10.2 | 10.2 | 10.2 | 10.2 |
| PV UFCF | ||||||||||
| SUM PV UFCF | 16,213.3 | |||||||||
| Long Term Growth Rate, % | 2.00 | |||||||||
| Free cash flow (T + 1) | 3,973 | |||||||||
| Terminal Value | 48,433 | |||||||||
| Present Terminal Value | 29,796 | |||||||||
| Enterprise Value | 46,009 | |||||||||
| Net Debt | 22,497 | |||||||||
| Equity Value | 23,512 | |||||||||
| Diluted Shares Outstanding, MM | 1,331 | |||||||||
| Equity Value Per Share | 17.66 |
What You Will Get
- Real TFC Financials: Access to historical and projected data for precise valuation.
- Customizable Inputs: Adjust WACC, tax rates, revenue growth, and capital expenditures as needed.
- Dynamic Calculations: Intrinsic value and NPV are computed in real-time.
- Scenario Analysis: Explore various scenarios to assess Truist’s future performance.
- User-Friendly Design: Designed for professionals but easy for beginners to navigate.
Key Features
- Comprehensive DCF Calculator: Features detailed unlevered and levered DCF valuation models tailored for Truist Financial Corporation (TFC).
- WACC Calculator: Comes with a pre-configured Weighted Average Cost of Capital sheet that allows for customizable inputs.
- Adjustable Forecast Assumptions: Easily modify growth rates, capital expenditures, and discount rates to fit your analysis.
- Integrated Financial Ratios: Evaluate profitability, leverage, and efficiency ratios specifically for Truist Financial Corporation (TFC).
- Interactive Dashboard and Charts: Visual representations that summarize essential valuation metrics for straightforward analysis.
How It Works
- Step 1: Download the Excel file for Truist Financial Corporation (TFC).
- Step 2: Review the pre-filled financial data and forecasts for Truist.
- Step 3: Adjust key inputs such as revenue growth, WACC, and tax rates (highlighted cells).
- Step 4: Observe the DCF model update in real-time as you modify assumptions.
- Step 5: Evaluate the outputs and utilize the results for your investment strategies.
Why Choose This Calculator for Truist Financial Corporation (TFC)?
- Accurate Data: Utilize real Truist financials for dependable valuation outcomes.
- Customizable: Modify essential parameters such as growth rates, WACC, and tax rates to align with your forecasts.
- Time-Saving: Pre-configured calculations save you from starting from the ground up.
- Professional-Grade Tool: Tailored for investors, analysts, and financial consultants.
- User-Friendly: An intuitive design and guided instructions make it accessible for all users.
Who Should Use This Product?
- Finance Students: Master financial analysis techniques and implement them with real-world data.
- Academics: Integrate industry-standard models into your teaching or research projects.
- Investors: Validate your investment strategies and evaluate valuation scenarios for Truist Financial Corporation (TFC).
- Analysts: Enhance your efficiency with a ready-to-use, customizable DCF model.
- Small Business Owners: Understand how major financial institutions like Truist Financial Corporation (TFC) are assessed.
What the Template Contains
- Pre-Filled Data: Includes Truist Financial Corporation’s (TFC) historical financials and forecasts.
- Discounted Cash Flow Model: Editable DCF valuation model with automatic calculations.
- Weighted Average Cost of Capital (WACC): A dedicated sheet for calculating WACC based on custom inputs.
- Key Financial Ratios: Analyze Truist Financial Corporation’s (TFC) profitability, efficiency, and leverage.
- Customizable Inputs: Edit revenue growth, margins, and tax rates with ease.
- Clear Dashboard: Charts and tables summarizing key valuation results.
Disclaimer
All information, articles, and product details provided on this website are for general informational and educational purposes only. We do not claim any ownership over, nor do we intend to infringe upon, any trademarks, copyrights, logos, brand names, or other intellectual property mentioned or depicted on this site. Such intellectual property remains the property of its respective owners, and any references here are made solely for identification or informational purposes, without implying any affiliation, endorsement, or partnership.
We make no representations or warranties, express or implied, regarding the accuracy, completeness, or suitability of any content or products presented. Nothing on this website should be construed as legal, tax, investment, financial, medical, or other professional advice. In addition, no part of this site—including articles or product references—constitutes a solicitation, recommendation, endorsement, advertisement, or offer to buy or sell any securities, franchises, or other financial instruments, particularly in jurisdictions where such activity would be unlawful.
All content is of a general nature and may not address the specific circumstances of any individual or entity. It is not a substitute for professional advice or services. Any actions you take based on the information provided here are strictly at your own risk. You accept full responsibility for any decisions or outcomes arising from your use of this website and agree to release us from any liability in connection with your use of, or reliance upon, the content or products found herein.