
|
Trilogy Metals Inc. (TMQ) تقييم DCF |
Fully Editable: Tailor To Your Needs In Excel Or Sheets
Professional Design: Trusted, Industry-Standard Templates
Investor-Approved Valuation Models
MAC/PC Compatible, Fully Unlocked
No Expertise Is Needed; Easy To Follow
Trilogy Metals Inc. (TMQ) Bundle
تقييم آفاق Trilogy Metals Inc. (TMQ) مثل الخبير! تأتي حاسبة DCF (TMQ) هذه مع بيانات مالية مملوءة مسبقًا وتوفر لك المرونة لتعديل نمو الإيرادات ، و WACC ، والهوامش ، وغيرها من الافتراضات الحاسمة التي تتماشى مع توقعاتك.
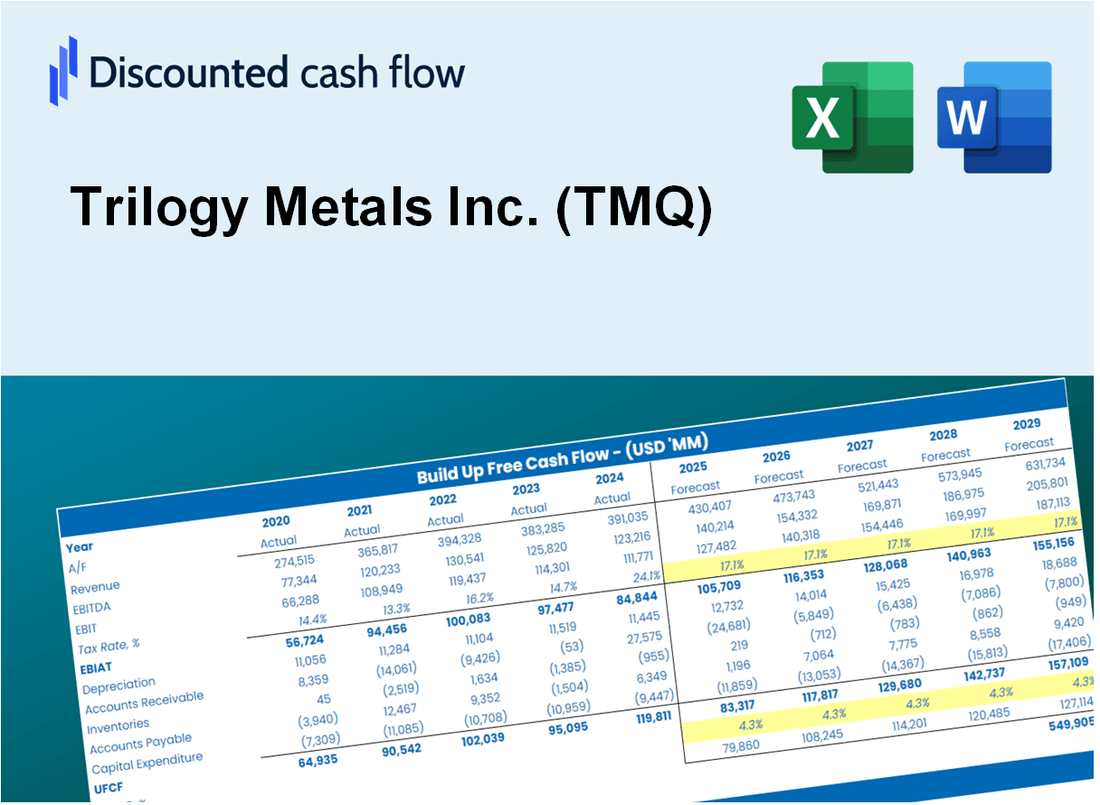
Discounted Cash Flow (DCF) - (USD MM)
| Year | AY1 2020 |
AY2 2021 |
AY3 2022 |
AY4 2023 |
AY5 2024 |
FY1 2025 |
FY2 2026 |
FY3 2027 |
FY4 2028 |
FY5 2029 |
|---|---|---|---|---|---|---|---|---|---|---|
| Revenue | .0 | .0 | .0 | .0 | .0 | .0 | .0 | .0 | .0 | .0 |
| Revenue Growth, % | 0 | 0 | 0 | 0 | 0 | 0 | 0 | 0 | 0 | 0 |
| EBITDA | -11.5 | -8.0 | -6.9 | -7.1 | -8.3 | .0 | .0 | .0 | .0 | .0 |
| EBITDA, % | 100 | 100 | 100 | 100 | 100 | 100 | 100 | 100 | 100 | 100 |
| Depreciation | .3 | .0 | .0 | -.1 | .0 | .0 | .0 | .0 | .0 | .0 |
| Depreciation, % | 100 | 100 | 100 | 100 | 100 | 100 | 100 | 100 | 100 | 100 |
| EBIT | -11.8 | -8.0 | -7.0 | -7.0 | -8.4 | .0 | .0 | .0 | .0 | .0 |
| EBIT, % | 100 | 100 | 100 | 100 | 100 | 100 | 100 | 100 | 100 | 100 |
| Total Cash | 11.1 | 6.3 | 2.6 | 2.8 | 25.8 | .0 | .0 | .0 | .0 | .0 |
| Total Cash, percent | .0 | .0 | .0 | .0 | .0 | .0 | .0 | .0 | .0 | .0 |
| Account Receivables | .1 | .0 | .0 | .0 | .0 | .0 | .0 | .0 | .0 | .0 |
| Account Receivables, % | 100 | 100 | 100 | 100 | 100 | 100 | 100 | 100 | 100 | 100 |
| Inventories | -.4 | .0 | -.5 | .0 | .0 | .0 | .0 | .0 | .0 | .0 |
| Inventories, % | 100 | 100 | 100 | 100 | 100 | 100 | 100 | 100 | 100 | 100 |
| Accounts Payable | .2 | .2 | .2 | .1 | .2 | .0 | .0 | .0 | .0 | .0 |
| Accounts Payable, % | 100 | 100 | 100 | 100 | 100 | 100 | 100 | 100 | 100 | 100 |
| Capital Expenditure | .0 | -.1 | .0 | .0 | .0 | .0 | .0 | .0 | .0 | .0 |
| Capital Expenditure, % | 100 | 100 | 100 | 100 | 100 | 0 | 0 | 0 | 0 | 0 |
| Tax Rate, % | 0 | 0 | 0 | 0 | 0 | 0 | 0 | 0 | 0 | 0 |
| EBITAT | -24.5 | -8.0 | -13.9 | -7.0 | -8.4 | .0 | .0 | .0 | .0 | .0 |
| Depreciation | ||||||||||
| Changes in Account Receivables | ||||||||||
| Changes in Inventories | ||||||||||
| Changes in Accounts Payable | ||||||||||
| Capital Expenditure | ||||||||||
| UFCF | -23.8 | -8.4 | -13.4 | -7.7 | -8.3 | -.2 | .0 | .0 | .0 | .0 |
| WACC, % | 12.47 | 12.47 | 12.47 | 12.47 | 12.47 | 12.47 | 12.47 | 12.47 | 12.47 | 12.47 |
| PV UFCF | ||||||||||
| SUM PV UFCF | -.2 | |||||||||
| Long Term Growth Rate, % | 2.00 | |||||||||
| Free cash flow (T + 1) | 0 | |||||||||
| Terminal Value | 0 | |||||||||
| Present Terminal Value | 0 | |||||||||
| Enterprise Value | 0 | |||||||||
| Net Debt | -26 | |||||||||
| Equity Value | 26 | |||||||||
| Diluted Shares Outstanding, MM | 160 | |||||||||
| Equity Value Per Share | 0.16 |
What You Will Receive
- Genuine Trilogy Metals Data: Preloaded financials – from revenue to EBIT – based on actual and projected figures.
- Comprehensive Customization: Modify all essential parameters (yellow cells) such as WACC, growth %, and tax rates.
- Immediate Valuation Updates: Automatic recalculations to assess the impact of changes on Trilogy Metals’ fair value.
- Flexible Excel Template: Designed for quick modifications, scenario analysis, and in-depth projections.
- Efficient and Precise: Avoid the hassle of building models from scratch while ensuring accuracy and adaptability.
Key Features
- Comprehensive Financial Data: Trilogy Metals Inc.'s historical financial statements and pre-filled projections.
- Customizable Parameters: Adjust WACC, tax rates, revenue growth, and EBITDA margins to suit your analysis.
- Real-Time Valuation: Observe Trilogy Metals Inc.'s intrinsic value update instantly.
- Intuitive Visual Displays: Dashboard graphs present valuation outcomes and essential metrics clearly.
- Designed for Precision: A robust tool tailored for analysts, investors, and finance professionals.
How It Works
- Step 1: Download the Excel file.
- Step 2: Review pre-entered Trilogy Metals Inc. (TMQ) data (historical and projected).
- Step 3: Adjust key assumptions (yellow cells) based on your analysis.
- Step 4: View automatic recalculations for Trilogy Metals Inc. (TMQ)’s intrinsic value.
- Step 5: Use the outputs for investment decisions or reporting.
Why Choose This Calculator for Trilogy Metals Inc. (TMQ)?
- All-in-One Solution: Features DCF, WACC, and financial ratio analyses tailored for Trilogy Metals Inc. (TMQ).
- Flexible Inputs: Modify yellow-highlighted cells to explore different investment scenarios.
- In-Depth Analysis: Automatically computes Trilogy Metals Inc. (TMQ)’s intrinsic value and Net Present Value.
- Preloaded Information: Historical and projected data provide reliable starting points for analysis.
- Expert-Level Tool: Perfect for financial analysts, investors, and business advisors focused on Trilogy Metals Inc. (TMQ).
Who Should Use Trilogy Metals Inc. (TMQ)?
- Investors: Gain insights and make informed investment choices in the mining sector.
- Financial Analysts: Utilize comprehensive data to streamline your analysis of mining stocks.
- Consultants: Easily tailor reports for clients focusing on the mining and metals industry.
- Mining Enthusiasts: Enhance your knowledge of mining operations and market trends.
- Educators and Students: Use it as a resource for practical applications in mining finance courses.
What the Template Contains
- Historical Data: Includes Trilogy Metals Inc.’s (TMQ) past financials and baseline forecasts.
- DCF and Levered DCF Models: Detailed templates to calculate Trilogy Metals Inc.’s (TMQ) intrinsic value.
- WACC Sheet: Pre-built calculations for Weighted Average Cost of Capital.
- Editable Inputs: Modify key drivers like growth rates, EBITDA %, and CAPEX assumptions.
- Quarterly and Annual Statements: A complete breakdown of Trilogy Metals Inc.’s (TMQ) financials.
- Interactive Dashboard: Visualize valuation results and projections dynamically.
Disclaimer
All information, articles, and product details provided on this website are for general informational and educational purposes only. We do not claim any ownership over, nor do we intend to infringe upon, any trademarks, copyrights, logos, brand names, or other intellectual property mentioned or depicted on this site. Such intellectual property remains the property of its respective owners, and any references here are made solely for identification or informational purposes, without implying any affiliation, endorsement, or partnership.
We make no representations or warranties, express or implied, regarding the accuracy, completeness, or suitability of any content or products presented. Nothing on this website should be construed as legal, tax, investment, financial, medical, or other professional advice. In addition, no part of this site—including articles or product references—constitutes a solicitation, recommendation, endorsement, advertisement, or offer to buy or sell any securities, franchises, or other financial instruments, particularly in jurisdictions where such activity would be unlawful.
All content is of a general nature and may not address the specific circumstances of any individual or entity. It is not a substitute for professional advice or services. Any actions you take based on the information provided here are strictly at your own risk. You accept full responsibility for any decisions or outcomes arising from your use of this website and agree to release us from any liability in connection with your use of, or reliance upon, the content or products found herein.