
|
Tango Therapeutics ، Inc. (TNGX) DCF تقييم |
Fully Editable: Tailor To Your Needs In Excel Or Sheets
Professional Design: Trusted, Industry-Standard Templates
Investor-Approved Valuation Models
MAC/PC Compatible, Fully Unlocked
No Expertise Is Needed; Easy To Follow
Tango Therapeutics, Inc. (TNGX) Bundle
كمستثمر أو محلل ، تعد حاسبة DCF Tango Therapeutics ، Inc. (TNGX) موردك للتقييم الدقيق. يضم بيانات حقيقية من Tango Therapeutics ، يمكنك ضبط التوقعات ومراقبة الآثار على الفور.
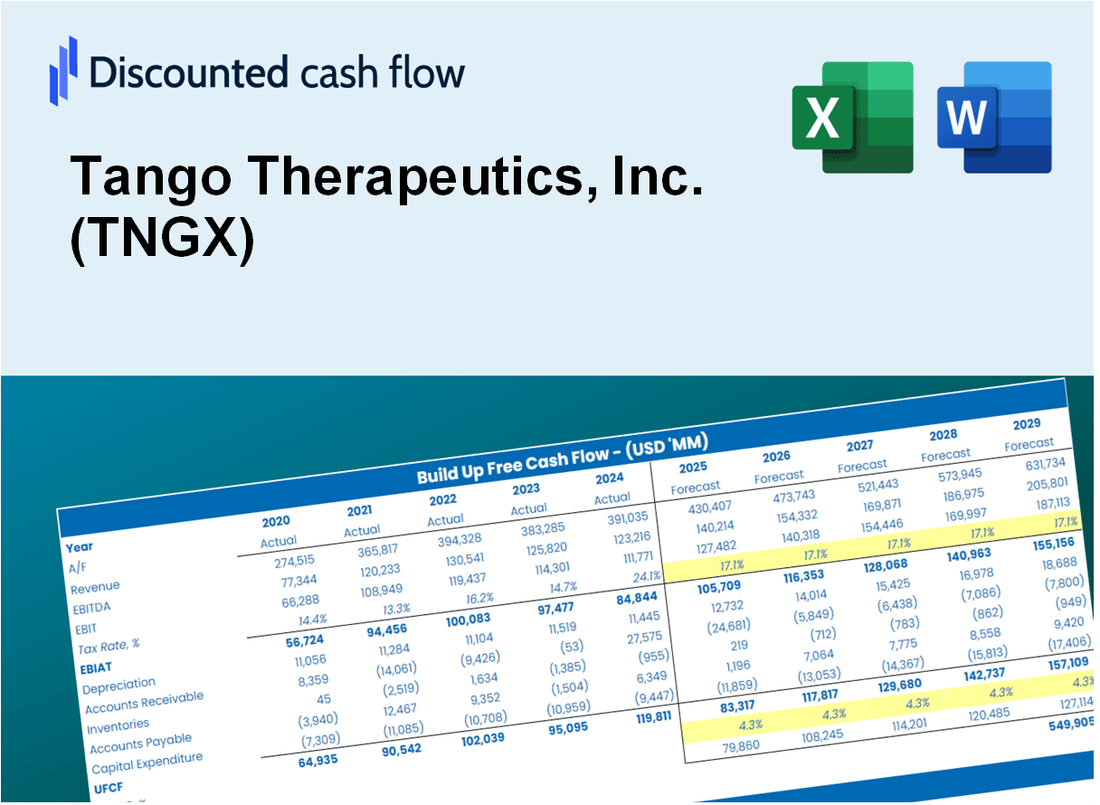
Discounted Cash Flow (DCF) - (USD MM)
| Year | AY1 2020 |
AY2 2021 |
AY3 2022 |
AY4 2023 |
AY5 2024 |
FY1 2025 |
FY2 2026 |
FY3 2027 |
FY4 2028 |
FY5 2029 |
|---|---|---|---|---|---|---|---|---|---|---|
| Revenue | 7.7 | 37.0 | 24.9 | 36.5 | 42.1 | 55.7 | 73.6 | 97.4 | 128.9 | 170.5 |
| Revenue Growth, % | 0 | 383.83 | -32.89 | 46.93 | 15.17 | 32.3 | 32.3 | 32.3 | 32.3 | 32.3 |
| EBITDA | -51.5 | -57.3 | -109.5 | -111.8 | -143.1 | -55.7 | -73.6 | -97.4 | -128.9 | -170.5 |
| EBITDA, % | -672.44 | -154.67 | -440.32 | -305.96 | -340.15 | -100 | -100 | -100 | -100 | -100 |
| Depreciation | 1.6 | .9 | 1.6 | 2.4 | 2.5 | 4.7 | 6.3 | 8.3 | 11.0 | 14.6 |
| Depreciation, % | 21.23 | 2.42 | 6.47 | 6.61 | 5.94 | 8.53 | 8.53 | 8.53 | 8.53 | 8.53 |
| EBIT | -53.1 | -58.2 | -111.1 | -114.2 | -145.6 | -55.7 | -73.6 | -97.4 | -128.9 | -170.5 |
| EBIT, % | -693.67 | -157.09 | -446.79 | -312.57 | -346.09 | -100 | -100 | -100 | -100 | -100 |
| Total Cash | 190.3 | 485.3 | 366.1 | 336.9 | 257.9 | 55.7 | 73.6 | 97.4 | 128.9 | 170.5 |
| Total Cash, percent | .0 | .0 | .0 | .0 | .0 | .0 | .0 | .0 | .0 | .0 |
| Account Receivables | 2.0 | 2.0 | 2.0 | .0 | .0 | 4.4 | 5.8 | 7.7 | 10.2 | 13.5 |
| Account Receivables, % | 26.12 | 5.4 | 8.05 | 0 | 0 | 7.91 | 7.91 | 7.91 | 7.91 | 7.91 |
| Inventories | .0 | .0 | .0 | .0 | .0 | .0 | .0 | .0 | .0 | .0 |
| Inventories, % | 0 | 0 | 0 | 0 | 0 | 0 | 0 | 0 | 0 | 0 |
| Accounts Payable | 1.8 | 3.2 | 4.5 | 2.8 | 1.6 | 6.9 | 9.1 | 12.1 | 16.0 | 21.2 |
| Accounts Payable, % | 24.05 | 8.71 | 17.91 | 7.62 | 3.81 | 12.42 | 12.42 | 12.42 | 12.42 | 12.42 |
| Capital Expenditure | -1.1 | -1.8 | -7.7 | -1.5 | -.8 | -6.3 | -8.3 | -11.0 | -14.5 | -19.2 |
| Capital Expenditure, % | -14.45 | -4.96 | -30.94 | -4.18 | -1.79 | -11.26 | -11.26 | -11.26 | -11.26 | -11.26 |
| Tax Rate, % | -0.15988 | -0.15988 | -0.15988 | -0.15988 | -0.15988 | -0.15988 | -0.15988 | -0.15988 | -0.15988 | -0.15988 |
| EBITAT | -53.0 | -58.5 | -111.1 | -114.3 | -145.8 | -55.6 | -73.6 | -97.4 | -128.8 | -170.5 |
| Depreciation | ||||||||||
| Changes in Account Receivables | ||||||||||
| Changes in Inventories | ||||||||||
| Changes in Accounts Payable | ||||||||||
| Capital Expenditure | ||||||||||
| UFCF | -52.6 | -58.0 | -116.0 | -113.1 | -145.3 | -56.2 | -74.8 | -99.0 | -130.9 | -173.2 |
| WACC, % | 11.69 | 11.69 | 11.69 | 11.69 | 11.69 | 11.69 | 11.69 | 11.69 | 11.69 | 11.69 |
| PV UFCF | ||||||||||
| SUM PV UFCF | -365.2 | |||||||||
| Long Term Growth Rate, % | 2.00 | |||||||||
| Free cash flow (T + 1) | -177 | |||||||||
| Terminal Value | -1,823 | |||||||||
| Present Terminal Value | -1,049 | |||||||||
| Enterprise Value | -1,414 | |||||||||
| Net Debt | -33 | |||||||||
| Equity Value | -1,381 | |||||||||
| Diluted Shares Outstanding, MM | 109 | |||||||||
| Equity Value Per Share | -12.64 |
What You Will Get
- Comprehensive TNGX Financials: Access to both historical data and future projections for precise valuation.
- Customizable Inputs: Adjust WACC, tax rates, revenue growth, and capital expenditures as needed.
- Dynamic Calculations: Intrinsic value and NPV are computed automatically in real-time.
- Scenario Analysis: Explore various scenarios to assess Tango Therapeutics' potential performance.
- User-Friendly Interface: Designed for industry professionals while remaining easy to navigate for newcomers.
Key Features
- Comprehensive DCF Calculator: Features detailed unlevered and levered DCF valuation models tailored for Tango Therapeutics, Inc. (TNGX).
- WACC Calculator: Pre-configured Weighted Average Cost of Capital sheet with adjustable inputs specific to the biotech sector.
- Customizable Forecast Assumptions: Adjust growth rates, capital expenditures, and discount rates to reflect market conditions.
- Integrated Financial Ratios: Evaluate profitability, leverage, and efficiency ratios relevant to Tango Therapeutics, Inc. (TNGX).
- Interactive Dashboard and Charts: Visual representations of key valuation metrics for straightforward analysis.
How It Works
- Download: Get the comprehensive Excel file featuring Tango Therapeutics' (TNGX) financial data.
- Customize: Tailor your forecasts, including revenue growth, EBITDA %, and WACC.
- Update Automatically: Watch as intrinsic value and NPV calculations refresh in real-time.
- Test Scenarios: Generate various projections and instantly compare results.
- Make Decisions: Leverage the valuation outcomes to inform your investment approach.
Why Choose Tango Therapeutics Calculator?
- Comprehensive Tool: Incorporates DCF, WACC, and financial ratio analyses tailored for Tango Therapeutics (TNGX).
- Customizable Inputs: Modify yellow-highlighted cells to explore different financial scenarios for TNGX.
- Detailed Insights: Automatically computes Tango Therapeutics’ intrinsic value and Net Present Value.
- Preloaded Data: Historical and projected data provide reliable starting points for analysis.
- Professional Quality: Perfect for financial analysts, investors, and healthcare consultants focused on TNGX.
Who Should Use Tango Therapeutics, Inc. (TNGX)?
- Investors: Make informed decisions with insights into innovative therapeutic developments.
- Healthcare Analysts: Streamline your research with comprehensive data on drug pipelines and market potential.
- Consultants: Easily modify presentations for clients focused on biotechnology and pharmaceuticals.
- Biotech Enthusiasts: Enhance your knowledge of cutting-edge therapies and their implications in healthcare.
- Educators and Students: Utilize it as a valuable resource for courses in biotechnology and pharmaceutical sciences.
What the Template Contains
- Comprehensive DCF Model: Editable template featuring detailed valuation calculations tailored for Tango Therapeutics.
- Real-World Data: Tango Therapeutics’ historical and projected financials preloaded for in-depth analysis.
- Customizable Parameters: Modify WACC, growth rates, and tax assumptions to explore various scenarios.
- Financial Statements: Complete annual and quarterly breakdowns for enhanced insights into performance.
- Key Ratios: Integrated analysis for profitability, efficiency, and leverage metrics specific to Tango Therapeutics.
- Dashboard with Visual Outputs: Visual representations including charts and tables for clear, actionable results.
Disclaimer
All information, articles, and product details provided on this website are for general informational and educational purposes only. We do not claim any ownership over, nor do we intend to infringe upon, any trademarks, copyrights, logos, brand names, or other intellectual property mentioned or depicted on this site. Such intellectual property remains the property of its respective owners, and any references here are made solely for identification or informational purposes, without implying any affiliation, endorsement, or partnership.
We make no representations or warranties, express or implied, regarding the accuracy, completeness, or suitability of any content or products presented. Nothing on this website should be construed as legal, tax, investment, financial, medical, or other professional advice. In addition, no part of this site—including articles or product references—constitutes a solicitation, recommendation, endorsement, advertisement, or offer to buy or sell any securities, franchises, or other financial instruments, particularly in jurisdictions where such activity would be unlawful.
All content is of a general nature and may not address the specific circumstances of any individual or entity. It is not a substitute for professional advice or services. Any actions you take based on the information provided here are strictly at your own risk. You accept full responsibility for any decisions or outcomes arising from your use of this website and agree to release us from any liability in connection with your use of, or reliance upon, the content or products found herein.