
|
Troops ، Inc. (TROO) تقييم DCF |
Fully Editable: Tailor To Your Needs In Excel Or Sheets
Professional Design: Trusted, Industry-Standard Templates
Investor-Approved Valuation Models
MAC/PC Compatible, Fully Unlocked
No Expertise Is Needed; Easy To Follow
TROOPS, Inc. (TROO) Bundle
هل تتطلع إلى تقييم القيمة الجوهرية لشركة TROVES، Inc. ؟ تدمج حاسبة TROO DCF الخاصة بنا بيانات العالم الحقيقي مع ميزات تخصيص واسعة النطاق، مما يتيح لك تحسين توقعاتك وتعزيز قرارات الاستثمار الخاصة بك.
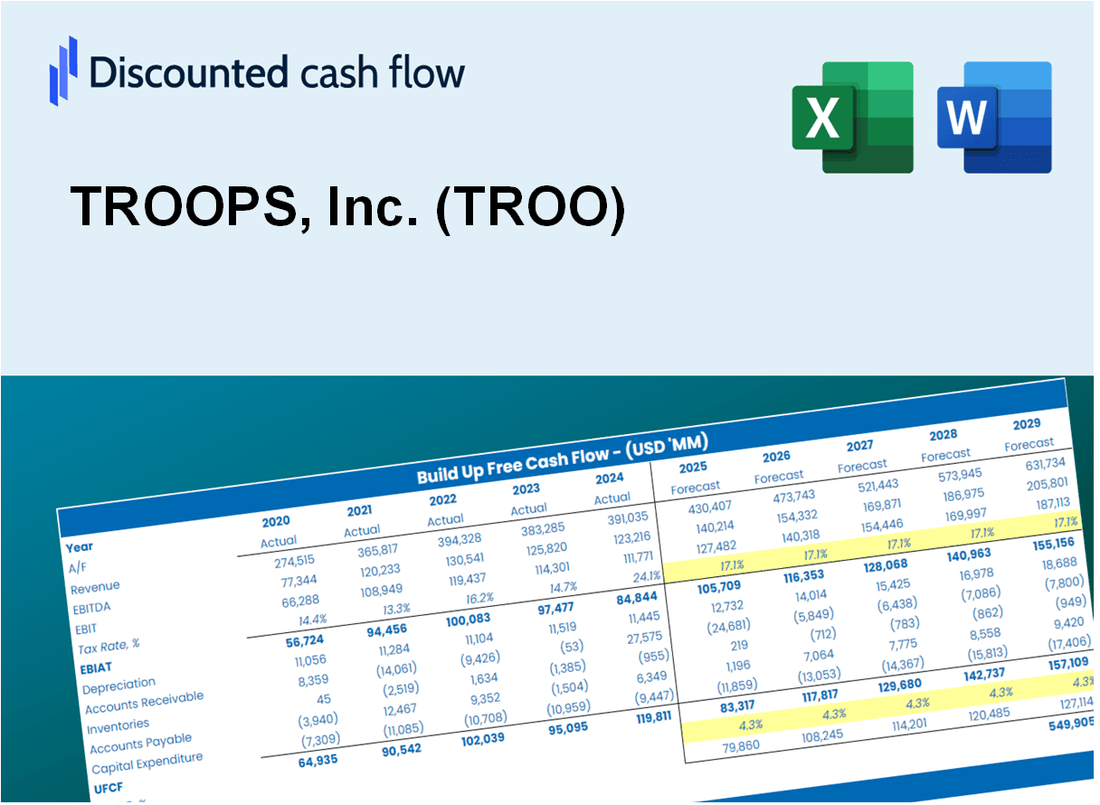
Discounted Cash Flow (DCF) - (USD MM)
| Year | AY1 2020 |
AY2 2021 |
AY3 2022 |
AY4 2023 |
AY5 2024 |
FY1 2025 |
FY2 2026 |
FY3 2027 |
FY4 2028 |
FY5 2029 |
|---|---|---|---|---|---|---|---|---|---|---|
| Revenue | 4.3 | 3.7 | 3.9 | 3.6 | 10.1 | 12.2 | 14.7 | 17.7 | 21.4 | 25.9 |
| Revenue Growth, % | 0 | -14.21 | 5.21 | -7.9 | 182.24 | 20.78 | 20.78 | 20.78 | 20.78 | 20.78 |
| EBITDA | -62.4 | -6.3 | 1.6 | .3 | -11.2 | -6.1 | -7.3 | -8.8 | -10.7 | -12.9 |
| EBITDA, % | -1453.79 | -171.11 | 41.99 | 8.94 | -111 | -49.81 | -49.81 | -49.81 | -49.81 | -49.81 |
| Depreciation | 4.8 | 2.1 | 2.0 | 2.1 | 2.2 | 7.1 | 8.5 | 10.3 | 12.4 | 15.0 |
| Depreciation, % | 111.83 | 57.94 | 50.84 | 59.29 | 21.89 | 57.99 | 57.99 | 57.99 | 57.99 | 57.99 |
| EBIT | -67.2 | -8.4 | -.3 | -1.8 | -13.4 | -8.7 | -10.6 | -12.7 | -15.4 | -18.6 |
| EBIT, % | -1565.62 | -229.05 | -8.85 | -50.35 | -132.89 | -71.84 | -71.84 | -71.84 | -71.84 | -71.84 |
| Total Cash | 3.0 | 3.5 | 3.0 | 3.1 | 5.2 | 9.2 | 11.2 | 13.5 | 16.3 | 19.7 |
| Total Cash, percent | .0 | .0 | .0 | .0 | .0 | .0 | .0 | .0 | .0 | .0 |
| Account Receivables | 22.5 | 2.6 | 8.5 | 7.3 | 14.1 | 11.4 | 13.8 | 16.7 | 20.1 | 24.3 |
| Account Receivables, % | 524.04 | 69.32 | 218.35 | 204.57 | 140.33 | 93.86 | 93.86 | 93.86 | 93.86 | 93.86 |
| Inventories | .0 | .0 | .0 | .0 | .0 | .0 | .0 | .0 | .0 | .0 |
| Inventories, % | 0 | 0 | 0 | 0 | 0 | 0 | 0 | 0 | 0 | 0 |
| Accounts Payable | .0 | 2.6 | 8.5 | .0 | 1.6 | 4.5 | 5.5 | 6.6 | 8.0 | 9.6 |
| Accounts Payable, % | 0 | 69.32 | 218.35 | 0 | 16.21 | 37.11 | 37.11 | 37.11 | 37.11 | 37.11 |
| Capital Expenditure | -.1 | -.4 | -.2 | -.2 | -.3 | -.6 | -.8 | -.9 | -1.1 | -1.4 |
| Capital Expenditure, % | -2.75 | -10.92 | -4.03 | -6.19 | -2.49 | -5.27 | -5.27 | -5.27 | -5.27 | -5.27 |
| Tax Rate, % | -0.2017 | -0.2017 | -0.2017 | -0.2017 | -0.2017 | -0.2017 | -0.2017 | -0.2017 | -0.2017 | -0.2017 |
| EBITAT | -66.9 | -8.3 | -.3 | -1.7 | -13.4 | -8.3 | -10.1 | -12.2 | -14.7 | -17.7 |
| Depreciation | ||||||||||
| Changes in Account Receivables | ||||||||||
| Changes in Inventories | ||||||||||
| Changes in Accounts Payable | ||||||||||
| Capital Expenditure | ||||||||||
| UFCF | -84.7 | 15.9 | 1.5 | -7.1 | -16.7 | 3.7 | -3.8 | -4.5 | -5.5 | -6.6 |
| WACC, % | 18.19 | 18.19 | 18.19 | 18.19 | 18.19 | 18.19 | 18.19 | 18.19 | 18.19 | 18.19 |
| PV UFCF | ||||||||||
| SUM PV UFCF | -8.0 | |||||||||
| Long Term Growth Rate, % | 2.00 | |||||||||
| Free cash flow (T + 1) | -7 | |||||||||
| Terminal Value | -42 | |||||||||
| Present Terminal Value | -18 | |||||||||
| Enterprise Value | -26 | |||||||||
| Net Debt | -5 | |||||||||
| Equity Value | -21 | |||||||||
| Diluted Shares Outstanding, MM | 102 | |||||||||
| Equity Value Per Share | -0.20 |
What You Will Receive
- Comprehensive Financial Model: TROOPS, Inc.’s actual data facilitates accurate DCF valuation.
- Complete Forecasting Control: Modify revenue growth, profit margins, WACC, and other essential drivers.
- Real-Time Calculations: Automatic updates provide immediate insights as you adjust parameters.
- Professional-Grade Template: A polished Excel file crafted for high-quality valuation.
- Flexible and Reusable: Designed for adaptability, allowing for repeated use in detailed forecasting.
Key Features
- Comprehensive Sales Forecasting Tool: Offers detailed models for revenue projections and market analysis.
- Customer Acquisition Cost (CAC) Calculator: Pre-configured sheet to analyze and optimize customer acquisition expenses.
- Customizable Growth Metrics: Adjust parameters for user engagement, retention rates, and revenue growth.
- Integrated Performance Metrics: Evaluate key performance indicators like conversion rates and customer lifetime value for TROOPS, Inc. (TROO).
- Dynamic Reporting Dashboard: Visual representations of sales data and trends for streamlined decision-making.
How It Works
- 1. Download the Template: Access and open the Excel file containing TROOPS, Inc.'s (TROO) preloaded data.
- 2. Adjust Key Inputs: Modify essential parameters such as growth rates, WACC, and capital expenditures.
- 3. Instant Results: The DCF model automatically computes intrinsic value and NPV in real-time.
- 4. Explore Different Scenarios: Evaluate various forecasts to understand diverse valuation results.
- 5. Present with Assurance: Deliver expert valuation insights to reinforce your strategic decisions.
Why Choose the TROOPS Calculator?
- Designed for Experts: A sophisticated tool utilized by industry professionals, financial analysts, and strategic consultants.
- Accurate Financial Data: TROOPS, Inc.'s historical and future financials are preloaded for precision.
- Comprehensive Scenario Analysis: Effortlessly simulate various forecasts and assumptions.
- Insightful Outputs: Automatically computes intrinsic value, NPV, and essential financial metrics.
- User-Friendly Interface: Detailed step-by-step guidance to simplify the calculation process.
Who Should Use This Product?
- Investors: Evaluate TROOPS, Inc. (TROO) to make informed decisions on stock transactions.
- CFOs and Financial Analysts: Enhance valuation methodologies and validate financial forecasts.
- Startup Founders: Discover how established companies like TROOPS, Inc. (TROO) are appraised.
- Consultants: Create comprehensive valuation reports for your clients' needs.
- Students and Educators: Utilize current data to practice and teach valuation strategies.
What the TROOPS, Inc. (TROO) Template Contains
- Comprehensive DCF Model: Editable template featuring detailed valuation calculations tailored for TROOPS, Inc. (TROO).
- Real-World Data: TROOPS, Inc. (TROO)’s historical and projected financials preloaded for in-depth analysis.
- Customizable Parameters: Adjust WACC, growth rates, and tax assumptions to explore various scenarios specific to TROOPS, Inc. (TROO).
- Financial Statements: Complete annual and quarterly breakdowns for enhanced insights into TROOPS, Inc. (TROO).
- Key Ratios: Built-in analysis focusing on profitability, efficiency, and leverage metrics for TROOPS, Inc. (TROO).
- Dashboard with Visual Outputs: Charts and tables designed for clear, actionable results regarding TROOPS, Inc. (TROO).
Disclaimer
All information, articles, and product details provided on this website are for general informational and educational purposes only. We do not claim any ownership over, nor do we intend to infringe upon, any trademarks, copyrights, logos, brand names, or other intellectual property mentioned or depicted on this site. Such intellectual property remains the property of its respective owners, and any references here are made solely for identification or informational purposes, without implying any affiliation, endorsement, or partnership.
We make no representations or warranties, express or implied, regarding the accuracy, completeness, or suitability of any content or products presented. Nothing on this website should be construed as legal, tax, investment, financial, medical, or other professional advice. In addition, no part of this site—including articles or product references—constitutes a solicitation, recommendation, endorsement, advertisement, or offer to buy or sell any securities, franchises, or other financial instruments, particularly in jurisdictions where such activity would be unlawful.
All content is of a general nature and may not address the specific circumstances of any individual or entity. It is not a substitute for professional advice or services. Any actions you take based on the information provided here are strictly at your own risk. You accept full responsibility for any decisions or outcomes arising from your use of this website and agree to release us from any liability in connection with your use of, or reliance upon, the content or products found herein.