
|
تقييم Trinseo PLC (TSE) DCF |
Fully Editable: Tailor To Your Needs In Excel Or Sheets
Professional Design: Trusted, Industry-Standard Templates
Investor-Approved Valuation Models
MAC/PC Compatible, Fully Unlocked
No Expertise Is Needed; Easy To Follow
Trinseo PLC (TSE) Bundle
تُمكّنك حاسبة DCF الخاصة بنا (TSE) DCF من تقييم تقييم Trinseo PLC باستخدام البيانات المالية في الوقت الفعلي وتوفر مرونة كاملة لتعديل جميع المعلمات الرئيسية للتوقعات المحسنة.
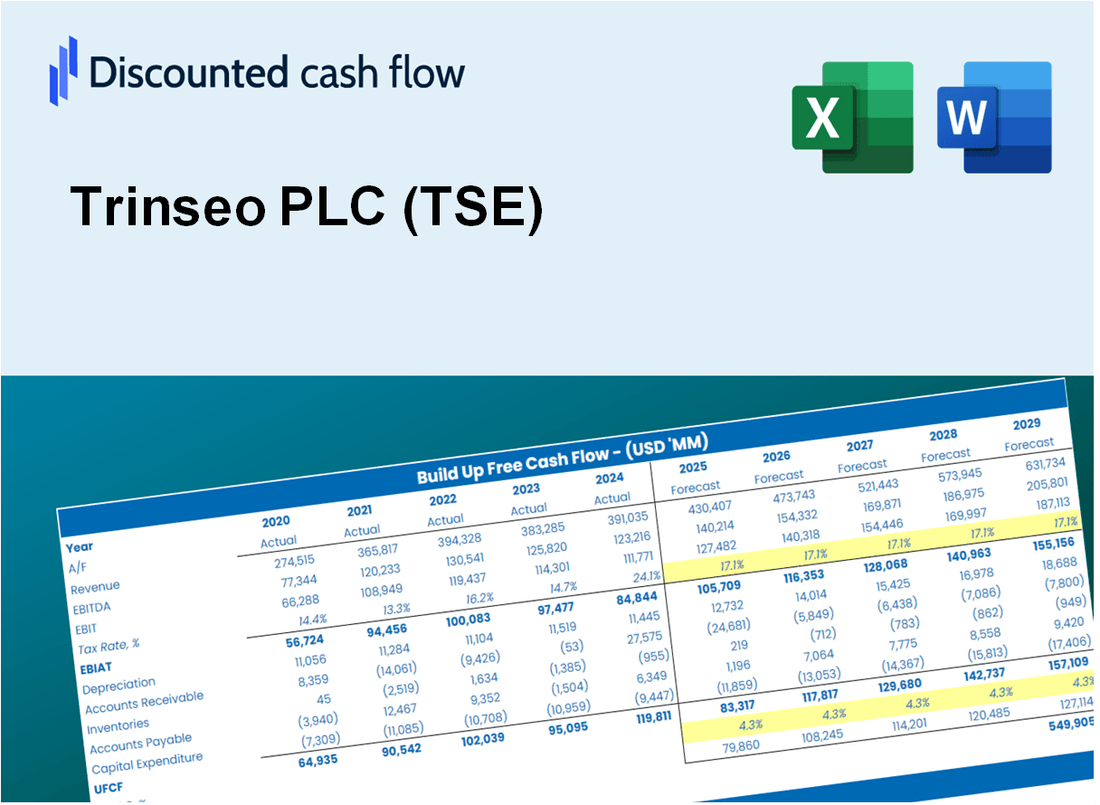
Discounted Cash Flow (DCF) - (USD MM)
| Year | AY1 2020 |
AY2 2021 |
AY3 2022 |
AY4 2023 |
AY5 2024 |
FY1 2025 |
FY2 2026 |
FY3 2027 |
FY4 2028 |
FY5 2029 |
|---|---|---|---|---|---|---|---|---|---|---|
| Revenue | 2,744.6 | 4,827.5 | 4,965.5 | 3,675.4 | 3,513.2 | 3,937.9 | 4,413.9 | 4,947.5 | 5,545.6 | 6,216.0 |
| Revenue Growth, % | 0 | 75.89 | 2.86 | -25.98 | -4.41 | 12.09 | 12.09 | 12.09 | 12.09 | 12.09 |
| EBITDA | 241.6 | 597.4 | -119.8 | -223.3 | 159.7 | 135.7 | 152.2 | 170.5 | 191.2 | 214.3 |
| EBITDA, % | 8.8 | 12.37 | -2.41 | -6.08 | 4.55 | 3.45 | 3.45 | 3.45 | 3.45 | 3.45 |
| Depreciation | 92.6 | 167.5 | 236.9 | 221.2 | 210.2 | 186.0 | 208.5 | 233.7 | 261.9 | 293.6 |
| Depreciation, % | 3.37 | 3.47 | 4.77 | 6.02 | 5.98 | 4.72 | 4.72 | 4.72 | 4.72 | 4.72 |
| EBIT | 149.0 | 429.9 | -356.7 | -444.5 | -50.5 | -50.3 | -56.3 | -63.1 | -70.8 | -79.3 |
| EBIT, % | 5.43 | 8.91 | -7.18 | -12.09 | -1.44 | -1.28 | -1.28 | -1.28 | -1.28 | -1.28 |
| Total Cash | 588.7 | 573.0 | 211.7 | 259.1 | 209.8 | 398.5 | 446.7 | 500.7 | 561.3 | 629.1 |
| Total Cash, percent | .0 | .0 | .0 | .0 | .0 | .0 | .0 | .0 | .0 | .0 |
| Account Receivables | 529.2 | 740.2 | 586.0 | 490.8 | 379.9 | 555.9 | 623.1 | 698.4 | 782.9 | 877.5 |
| Account Receivables, % | 19.28 | 15.33 | 11.8 | 13.35 | 10.81 | 14.12 | 14.12 | 14.12 | 14.12 | 14.12 |
| Inventories | 324.1 | 621.0 | 553.6 | 404.7 | 347.2 | 446.7 | 500.7 | 561.2 | 629.0 | 705.1 |
| Inventories, % | 11.81 | 12.86 | 11.15 | 11.01 | 9.88 | 11.34 | 11.34 | 11.34 | 11.34 | 11.34 |
| Accounts Payable | 313.9 | 516.8 | 365.3 | 376.0 | 220.4 | 362.3 | 406.1 | 455.2 | 510.2 | 571.9 |
| Accounts Payable, % | 11.44 | 10.71 | 7.36 | 10.23 | 6.27 | 9.2 | 9.2 | 9.2 | 9.2 | 9.2 |
| Capital Expenditure | -66.6 | -117.7 | -148.2 | -69.7 | -63.3 | -90.9 | -101.9 | -114.3 | -128.1 | -143.6 |
| Capital Expenditure, % | -2.43 | -2.44 | -2.98 | -1.9 | -1.8 | -2.31 | -2.31 | -2.31 | -2.31 | -2.31 |
| Tax Rate, % | -9.59 | -9.59 | -9.59 | -9.59 | -9.59 | -9.59 | -9.59 | -9.59 | -9.59 | -9.59 |
| EBITAT | 11.2 | 539.7 | -327.3 | -492.5 | -55.3 | -40.1 | -45.0 | -50.4 | -56.5 | -63.3 |
| Depreciation | ||||||||||
| Changes in Account Receivables | ||||||||||
| Changes in Inventories | ||||||||||
| Changes in Accounts Payable | ||||||||||
| Capital Expenditure | ||||||||||
| UFCF | -502.2 | 284.5 | -168.5 | -86.2 | 104.4 | -78.6 | -15.8 | -17.8 | -19.9 | -22.3 |
| WACC, % | 0.94289 | 10.79 | 9.92 | 10.79 | 10.79 | 8.65 | 8.65 | 8.65 | 8.65 | 8.65 |
| PV UFCF | ||||||||||
| SUM PV UFCF | -128.7 | |||||||||
| Long Term Growth Rate, % | 2.00 | |||||||||
| Free cash flow (T + 1) | -23 | |||||||||
| Terminal Value | -342 | |||||||||
| Present Terminal Value | -226 | |||||||||
| Enterprise Value | -355 | |||||||||
| Net Debt | 2,268 | |||||||||
| Equity Value | -2,623 | |||||||||
| Diluted Shares Outstanding, MM | 35 | |||||||||
| Equity Value Per Share | -74.30 |
What You Will Receive
- Pre-Filled Financial Model: Trinseo PLC’s (TSE) actual data provides accurate DCF valuation.
- Comprehensive Forecast Control: Modify revenue growth, profit margins, WACC, and other essential drivers.
- Real-Time Calculations: Automatic updates allow you to view outcomes instantly as adjustments are made.
- Professional-Grade Template: A polished Excel file crafted for high-quality valuation presentations.
- Flexible and Reusable: Designed for adaptability, enabling multiple uses for thorough forecasts.
Key Features
- Comprehensive Financial Data: Trinseo PLC’s historical financial records and pre-populated forecasts.
- Customizable Parameters: Modify WACC, tax rates, revenue growth, and EBITDA margins as needed.
- Real-Time Calculations: Monitor Trinseo PLC’s intrinsic value updates instantly.
- Visual Data Representation: Interactive dashboard charts showcase valuation outcomes and essential metrics.
- Designed for Precision: A robust tool tailored for analysts, investors, and finance professionals.
How It Works
- Step 1: Download the Excel file for Trinseo PLC (TSE).
- Step 2: Review Trinseo’s pre-filled financial data and forecasts.
- Step 3: Modify key inputs such as revenue growth, WACC, and tax rates (highlighted cells).
- Step 4: Observe the DCF model update in real-time as you adjust your assumptions.
- Step 5: Analyze the outputs and leverage the results for your investment decisions.
Why Choose This Calculator for Trinseo PLC (TSE)?
- Designed for Experts: A sophisticated tool tailored for analysts, CFOs, and industry consultants.
- Accurate Financial Data: Trinseo's historical and projected financials are preloaded for precise calculations.
- Flexible Scenario Analysis: Effortlessly test various forecasts and assumptions.
- Transparent Results: Automatically computes intrinsic value, NPV, and essential financial metrics.
- User-Friendly: Comprehensive step-by-step guidance simplifies the process.
Who Should Use This Product?
- Investors: Assess Trinseo PLC’s (TSE) valuation prior to making investment decisions.
- CFOs and Financial Analysts: Optimize valuation methodologies and validate forecasts for Trinseo PLC (TSE).
- Startup Founders: Understand how established companies like Trinseo PLC (TSE) are appraised in the market.
- Consultants: Create detailed valuation reports for clients focusing on Trinseo PLC (TSE).
- Students and Educators: Utilize real-time data from Trinseo PLC (TSE) to teach and practice valuation strategies.
What the Template Contains
- Pre-Filled DCF Model: Trinseo PLC’s (TSE) financial data preloaded for immediate use.
- WACC Calculator: Detailed calculations for Weighted Average Cost of Capital.
- Financial Ratios: Evaluate Trinseo PLC’s (TSE) profitability, leverage, and efficiency.
- Editable Inputs: Change assumptions such as growth, margins, and CAPEX to fit your scenarios.
- Financial Statements: Annual and quarterly reports to support detailed analysis.
- Interactive Dashboard: Easily visualize key valuation metrics and results.
Disclaimer
All information, articles, and product details provided on this website are for general informational and educational purposes only. We do not claim any ownership over, nor do we intend to infringe upon, any trademarks, copyrights, logos, brand names, or other intellectual property mentioned or depicted on this site. Such intellectual property remains the property of its respective owners, and any references here are made solely for identification or informational purposes, without implying any affiliation, endorsement, or partnership.
We make no representations or warranties, express or implied, regarding the accuracy, completeness, or suitability of any content or products presented. Nothing on this website should be construed as legal, tax, investment, financial, medical, or other professional advice. In addition, no part of this site—including articles or product references—constitutes a solicitation, recommendation, endorsement, advertisement, or offer to buy or sell any securities, franchises, or other financial instruments, particularly in jurisdictions where such activity would be unlawful.
All content is of a general nature and may not address the specific circumstances of any individual or entity. It is not a substitute for professional advice or services. Any actions you take based on the information provided here are strictly at your own risk. You accept full responsibility for any decisions or outcomes arising from your use of this website and agree to release us from any liability in connection with your use of, or reliance upon, the content or products found herein.