
|
Townsquare Media ، Inc. (TSQ) DCF تقييم |
Fully Editable: Tailor To Your Needs In Excel Or Sheets
Professional Design: Trusted, Industry-Standard Templates
Investor-Approved Valuation Models
MAC/PC Compatible, Fully Unlocked
No Expertise Is Needed; Easy To Follow
Townsquare Media, Inc. (TSQ) Bundle
عزز استراتيجيات الاستثمار الخاصة بك مع حاسبة Townsquare Media ، Inc. (TSQ) DCF! استكشاف البيانات المالية للمدينة الأصلية ، وضبط تنبؤات النمو والنفقات ، ومراقبة على الفور كيف تؤثر الاختلافات على القيمة الجوهرية لـ Townsquare.
What You Will Get
- Editable Forecast Inputs: Easily modify assumptions (growth %, margins, WACC) to explore various scenarios.
- Real-World Data: Townsquare Media’s financial data pre-loaded to kickstart your analysis.
- Automatic DCF Outputs: The template computes Net Present Value (NPV) and intrinsic value for you.
- Customizable and Professional: A refined Excel model that adjusts to your valuation requirements.
- Built for Analysts and Investors: Perfect for testing projections, validating strategies, and enhancing efficiency.
Key Features
- Comprehensive DCF Calculator: Features detailed unlevered and levered DCF valuation models tailored for Townsquare Media, Inc. (TSQ).
- WACC Calculator: Pre-configured Weighted Average Cost of Capital sheet with adjustable inputs for precise calculations.
- Customizable Forecast Assumptions: Easily alter growth rates, capital expenditures, and discount rates to fit your analysis.
- Integrated Financial Ratios: Evaluate profitability, leverage, and efficiency ratios specific to Townsquare Media, Inc. (TSQ).
- Interactive Dashboard and Charts: Visual representations that summarize essential valuation metrics for straightforward analysis.
How It Works
- Download the Template: Gain immediate access to the Excel-based Townsquare Media, Inc. (TSQ) DCF Calculator.
- Input Your Assumptions: Modify the yellow-highlighted cells for growth rates, WACC, margins, and other variables.
- Instant Calculations: The model automatically recalculates Townsquare Media’s intrinsic value.
- Test Scenarios: Experiment with different assumptions to assess potential valuation impacts.
- Analyze and Decide: Utilize the results to inform your investment or financial analysis.
Why Choose This Calculator for Townsquare Media, Inc. (TSQ)?
- Accurate Data: Utilize genuine Townsquare Media financials for trustworthy valuation outcomes.
- Customizable: Modify essential parameters such as growth rates, WACC, and tax rates to align with your forecasts.
- Time-Saving: Built-in calculations save you from starting from square one.
- Professional-Grade Tool: Tailored for investors, analysts, and consultants in the media sector.
- User-Friendly: An intuitive design and clear instructions make it accessible for all users.
Who Should Use This Product?
- Individual Investors: Make informed decisions about buying or selling Townsquare Media stock.
- Financial Analysts: Streamline valuation processes with ready-to-use financial models for Townsquare Media (TSQ).
- Consultants: Deliver professional valuation insights to clients quickly and accurately regarding Townsquare Media (TSQ).
- Business Owners: Understand how media companies like Townsquare Media (TSQ) are valued to guide your own strategy.
- Finance Students: Learn valuation techniques using real-world data and scenarios related to Townsquare Media (TSQ).
What the Template Contains
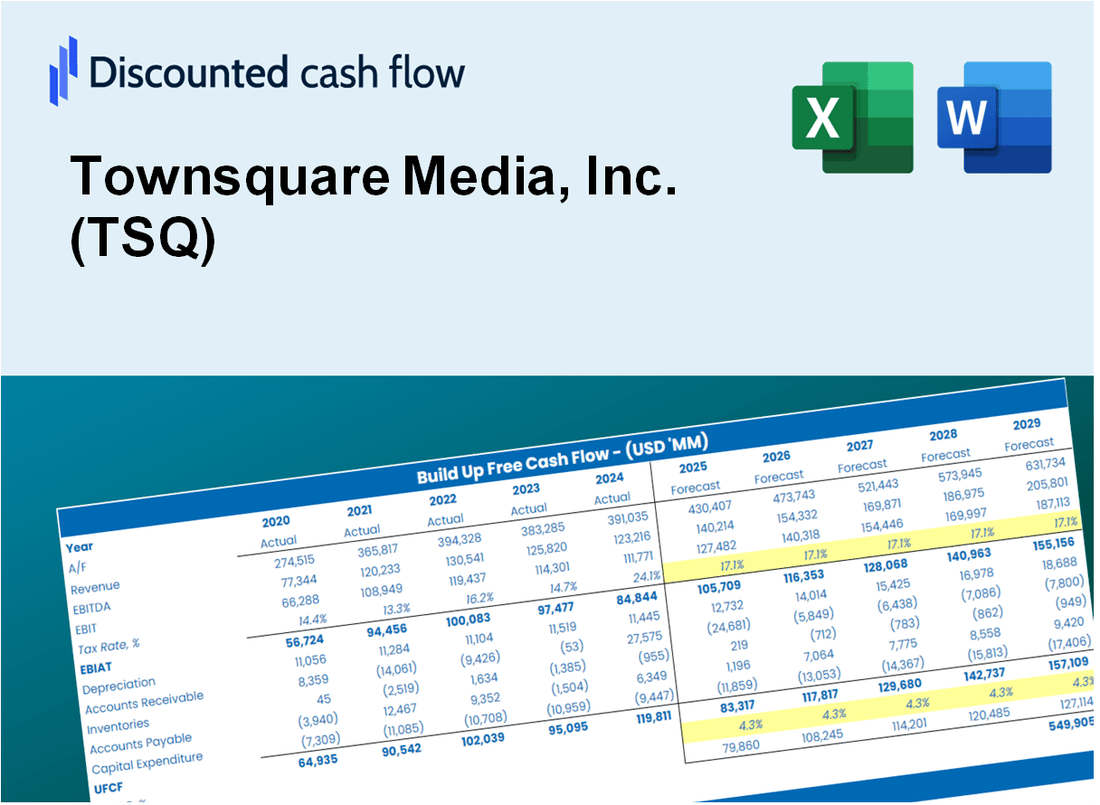
- Operating and Balance Sheet Data: Pre-filled Townsquare Media, Inc. (TSQ) historical data and forecasts, including revenue, EBITDA, EBIT, and capital expenditures.
- WACC Calculation: A dedicated sheet for Weighted Average Cost of Capital (WACC), featuring parameters such as Beta, risk-free rate, and share price.
- DCF Valuation (Unlevered and Levered): Editable Discounted Cash Flow models displaying intrinsic value with comprehensive calculations.
- Financial Statements: Pre-loaded financial statements (annual and quarterly) to facilitate thorough analysis.
- Key Ratios: Includes profitability, leverage, and efficiency ratios for Townsquare Media, Inc. (TSQ).
- Dashboard and Charts: Visual summary of valuation outputs and assumptions for easy result analysis.
Disclaimer
All information, articles, and product details provided on this website are for general informational and educational purposes only. We do not claim any ownership over, nor do we intend to infringe upon, any trademarks, copyrights, logos, brand names, or other intellectual property mentioned or depicted on this site. Such intellectual property remains the property of its respective owners, and any references here are made solely for identification or informational purposes, without implying any affiliation, endorsement, or partnership.
We make no representations or warranties, express or implied, regarding the accuracy, completeness, or suitability of any content or products presented. Nothing on this website should be construed as legal, tax, investment, financial, medical, or other professional advice. In addition, no part of this site—including articles or product references—constitutes a solicitation, recommendation, endorsement, advertisement, or offer to buy or sell any securities, franchises, or other financial instruments, particularly in jurisdictions where such activity would be unlawful.
All content is of a general nature and may not address the specific circumstances of any individual or entity. It is not a substitute for professional advice or services. Any actions you take based on the information provided here are strictly at your own risk. You accept full responsibility for any decisions or outcomes arising from your use of this website and agree to release us from any liability in connection with your use of, or reliance upon, the content or products found herein.