
|
Tetra Technologies ، Inc. (TTI) تقييم DCF |
Fully Editable: Tailor To Your Needs In Excel Or Sheets
Professional Design: Trusted, Industry-Standard Templates
Investor-Approved Valuation Models
MAC/PC Compatible, Fully Unlocked
No Expertise Is Needed; Easy To Follow
TETRA Technologies, Inc. (TTI) Bundle
عزز استراتيجيات الاستثمار الخاصة بك مع حاسبة Tetra Technologies ، Inc. (TTI) DCF! استكشاف البيانات المالية الأصلية ، وضبط توقعات النمو والنفقات ، ولاحظ كيف تؤثر هذه التعديلات على القيمة الجوهرية ل Tetra في الوقت الفعلي.
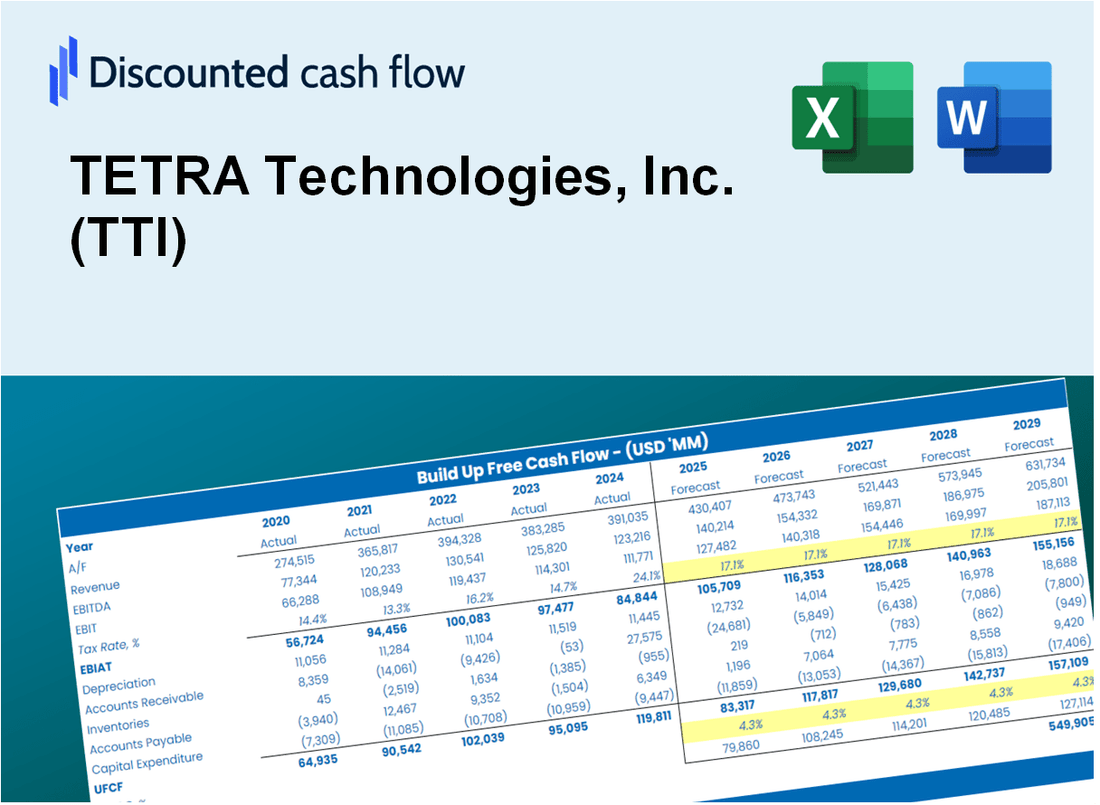
Discounted Cash Flow (DCF) - (USD MM)
| Year | AY1 2020 |
AY2 2021 |
AY3 2022 |
AY4 2023 |
AY5 2024 |
FY1 2025 |
FY2 2026 |
FY3 2027 |
FY4 2028 |
FY5 2029 |
|---|---|---|---|---|---|---|---|---|---|---|
| Revenue | 377.7 | 388.3 | 553.2 | 626.3 | 599.1 | 680.2 | 772.3 | 876.8 | 995.5 | 1,130.3 |
| Revenue Growth, % | 0 | 2.79 | 42.48 | 13.2 | -4.34 | 13.54 | 13.54 | 13.54 | 13.54 | 13.54 |
| EBITDA | 32.1 | 35.2 | 59.8 | 88.4 | 86.9 | 77.5 | 88.0 | 99.9 | 113.4 | 128.8 |
| EBITDA, % | 8.49 | 9.05 | 10.81 | 14.11 | 14.51 | 11.4 | 11.4 | 11.4 | 11.4 | 11.4 |
| Depreciation | 38.2 | 33.5 | 32.8 | 34.3 | 35.7 | 49.1 | 55.8 | 63.3 | 71.9 | 81.7 |
| Depreciation, % | 10.12 | 8.63 | 5.93 | 5.48 | 5.96 | 7.22 | 7.22 | 7.22 | 7.22 | 7.22 |
| EBIT | -6.2 | 1.7 | 27.0 | 54.0 | 51.2 | 28.4 | 32.2 | 36.6 | 41.5 | 47.1 |
| EBIT, % | -1.63 | 0.42651 | 4.88 | 8.63 | 8.55 | 4.17 | 4.17 | 4.17 | 4.17 | 4.17 |
| Total Cash | 67.3 | 31.6 | 13.6 | 52.5 | 37.2 | 58.5 | 66.4 | 75.4 | 85.6 | 97.2 |
| Total Cash, percent | .0 | .0 | .0 | .0 | .0 | .0 | .0 | .0 | .0 | .0 |
| Account Receivables | 64.1 | 91.2 | 129.6 | 111.8 | 104.8 | 135.0 | 153.3 | 174.0 | 197.6 | 224.3 |
| Account Receivables, % | 16.96 | 23.49 | 23.43 | 17.85 | 17.49 | 19.85 | 19.85 | 19.85 | 19.85 | 19.85 |
| Inventories | 76.7 | 69.1 | 72.1 | 96.5 | 101.7 | 113.6 | 129.0 | 146.5 | 166.3 | 188.8 |
| Inventories, % | 20.3 | 17.8 | 13.04 | 15.41 | 16.97 | 16.7 | 16.7 | 16.7 | 16.7 | 16.7 |
| Accounts Payable | 22.6 | 37.9 | 49.1 | 52.3 | 43.1 | 54.7 | 62.0 | 70.4 | 80.0 | 90.8 |
| Accounts Payable, % | 5.98 | 9.77 | 8.88 | 8.35 | 7.19 | 8.03 | 8.03 | 8.03 | 8.03 | 8.03 |
| Capital Expenditure | -29.4 | -20.5 | -40.1 | -38.2 | -60.7 | -49.7 | -56.4 | -64.1 | -72.7 | -82.6 |
| Capital Expenditure, % | -7.78 | -5.29 | -7.24 | -6.09 | -10.13 | -7.31 | -7.31 | -7.31 | -7.31 | -7.31 |
| Tax Rate, % | -276.74 | -276.74 | -276.74 | -276.74 | -276.74 | -276.74 | -276.74 | -276.74 | -276.74 | -276.74 |
| EBITAT | -12.6 | 1.9 | 19.0 | 44.0 | 192.9 | 25.6 | 29.1 | 33.0 | 37.5 | 42.6 |
| Depreciation | ||||||||||
| Changes in Account Receivables | ||||||||||
| Changes in Inventories | ||||||||||
| Changes in Accounts Payable | ||||||||||
| Capital Expenditure | ||||||||||
| UFCF | -121.9 | 10.7 | -18.5 | 36.7 | 160.6 | -5.5 | 2.2 | 2.5 | 2.8 | 3.2 |
| WACC, % | 10.02 | 10.02 | 9.34 | 9.59 | 10.02 | 9.8 | 9.8 | 9.8 | 9.8 | 9.8 |
| PV UFCF | ||||||||||
| SUM PV UFCF | 2.7 | |||||||||
| Long Term Growth Rate, % | 3.00 | |||||||||
| Free cash flow (T + 1) | 3 | |||||||||
| Terminal Value | 49 | |||||||||
| Present Terminal Value | 31 | |||||||||
| Enterprise Value | 33 | |||||||||
| Net Debt | 184 | |||||||||
| Equity Value | -151 | |||||||||
| Diluted Shares Outstanding, MM | 132 | |||||||||
| Equity Value Per Share | -1.14 |
What You Will Get
- Real TTI Financials: Access to historical and projected data for precise valuation.
- Customizable Inputs: Adjust WACC, tax rates, revenue growth, and capital expenditures as needed.
- Dynamic Calculations: Intrinsic value and NPV are computed in real-time.
- Scenario Analysis: Evaluate various scenarios to assess Tetra Technologies' future performance.
- User-Friendly Design: Designed for professionals but easy for newcomers to navigate.
Key Features
- Customizable Financial Inputs: Adjust essential parameters such as revenue projections, EBITDA margins, and capital investment plans.
- Instant DCF Valuation: Automatically computes intrinsic value, net present value (NPV), and other key metrics in real-time.
- High-Precision Accuracy: Leverages TETRA Technologies' actual financial data for dependable valuation results.
- Streamlined Scenario Analysis: Effortlessly evaluate various assumptions and analyze different outcomes.
- Efficiency Booster: Remove the hassle of constructing intricate valuation models from the ground up.
How It Works
- Download the Template: Gain immediate access to the Excel-based TETRA Technologies, Inc. (TTI) DCF Calculator.
- Input Your Assumptions: Modify the yellow-highlighted cells for growth rates, WACC, margins, and other variables.
- Instant Calculations: The model automatically recalculates TETRA Technologies, Inc.’s (TTI) intrinsic value.
- Test Scenarios: Explore various assumptions to assess potential changes in valuation.
- Analyze and Decide: Utilize the results to inform your investment or financial analysis.
Why Choose TETRA Technologies, Inc. (TTI) Calculator?
- Accuracy: Utilizes real TETRA Technologies financials for precise data.
- Flexibility: Allows users to easily test and adjust inputs as needed.
- Time-Saving: Eliminates the need to create a financial model from the ground up.
- Professional-Grade: Crafted with the expertise and usability expected at the CFO level.
- User-Friendly: Intuitive design makes it accessible for users of all financial backgrounds.
Who Should Use This Product?
- Environmental Scientists: Explore innovative technologies and their applications in water and oil management.
- Academics: Utilize industry-specific models in research and educational programs.
- Investors: Evaluate your investment strategies and analyze the performance metrics of TETRA Technologies, Inc. (TTI).
- Industry Analysts: Enhance your analysis with a customizable model tailored for the energy sector.
- Small Business Owners: Understand how large companies like TETRA Technologies, Inc. (TTI) navigate environmental challenges.
What the Template Contains
- Historical Data: Includes TETRA Technologies, Inc. (TTI)’s past financials and baseline forecasts.
- DCF and Levered DCF Models: Detailed templates to calculate TETRA Technologies, Inc. (TTI)’s intrinsic value.
- WACC Sheet: Pre-built calculations for Weighted Average Cost of Capital.
- Editable Inputs: Modify key drivers like growth rates, EBITDA %, and CAPEX assumptions.
- Quarterly and Annual Statements: A complete breakdown of TETRA Technologies, Inc. (TTI)’s financials.
- Interactive Dashboard: Visualize valuation results and projections dynamically.
Disclaimer
All information, articles, and product details provided on this website are for general informational and educational purposes only. We do not claim any ownership over, nor do we intend to infringe upon, any trademarks, copyrights, logos, brand names, or other intellectual property mentioned or depicted on this site. Such intellectual property remains the property of its respective owners, and any references here are made solely for identification or informational purposes, without implying any affiliation, endorsement, or partnership.
We make no representations or warranties, express or implied, regarding the accuracy, completeness, or suitability of any content or products presented. Nothing on this website should be construed as legal, tax, investment, financial, medical, or other professional advice. In addition, no part of this site—including articles or product references—constitutes a solicitation, recommendation, endorsement, advertisement, or offer to buy or sell any securities, franchises, or other financial instruments, particularly in jurisdictions where such activity would be unlawful.
All content is of a general nature and may not address the specific circumstances of any individual or entity. It is not a substitute for professional advice or services. Any actions you take based on the information provided here are strictly at your own risk. You accept full responsibility for any decisions or outcomes arising from your use of this website and agree to release us from any liability in connection with your use of, or reliance upon, the content or products found herein.