
|
قرص التوأم ، تقييم (توأم) DCF |
Fully Editable: Tailor To Your Needs In Excel Or Sheets
Professional Design: Trusted, Industry-Standard Templates
Investor-Approved Valuation Models
MAC/PC Compatible, Fully Unlocked
No Expertise Is Needed; Easy To Follow
Twin Disc, Incorporated (TWIN) Bundle
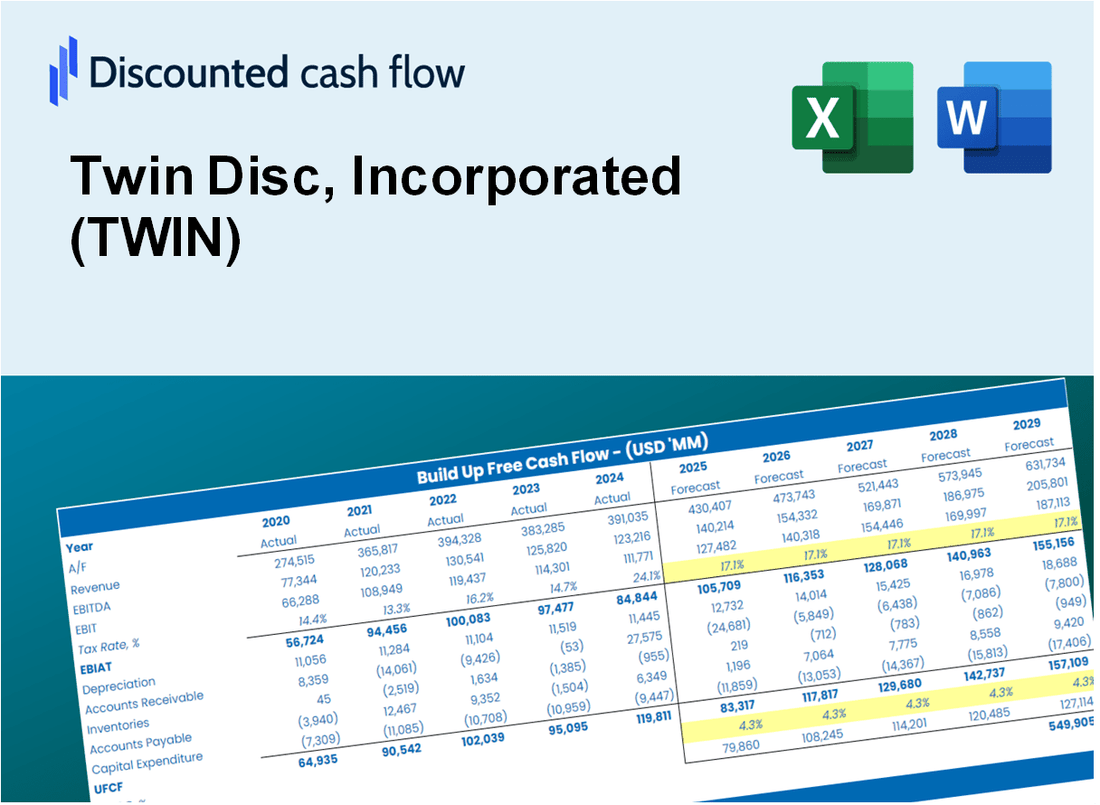
تقييم التوأم القرص ، التوقعات المالية لـ Incorporated مثل خبير! توفر حاسبة DCF (التوأم) هذه البيانات المالية المليئة مسبقًا إلى جانب المرونة الكاملة لتعديل نمو الإيرادات ، WACC ، الهوامش ، وغيرها من الافتراضات الأساسية التي تتماشى مع تنبؤاتك.
Discounted Cash Flow (DCF) - (USD MM)
| Year | AY1 2021 |
AY2 2022 |
AY3 2023 |
AY4 2024 |
AY5 2025 |
FY1 2026 |
FY2 2027 |
FY3 2028 |
FY4 2029 |
FY5 2030 |
|---|---|---|---|---|---|---|---|---|---|---|
| Revenue | 218.6 | 242.9 | 277.0 | 295.1 | 340.7 | 380.9 | 425.8 | 476.0 | 532.2 | 594.9 |
| Revenue Growth, % | 0 | 11.13 | 14.02 | 6.56 | 15.45 | 11.79 | 11.79 | 11.79 | 11.79 | 11.79 |
| EBITDA | 3.8 | 24.3 | 26.1 | 26.8 | 19.3 | 27.3 | 30.6 | 34.2 | 38.2 | 42.7 |
| EBITDA, % | 1.72 | 9.99 | 9.42 | 9.08 | 5.67 | 7.18 | 7.18 | 7.18 | 7.18 | 7.18 |
| Depreciation | 11.2 | 9.5 | 9.4 | 10.0 | 14.9 | 15.4 | 17.2 | 19.2 | 21.5 | 24.0 |
| Depreciation, % | 5.14 | 3.93 | 3.38 | 3.38 | 4.37 | 4.04 | 4.04 | 4.04 | 4.04 | 4.04 |
| EBIT | -7.5 | 14.7 | 16.7 | 16.8 | 4.4 | 11.9 | 13.3 | 14.9 | 16.7 | 18.6 |
| EBIT, % | -3.42 | 6.06 | 6.04 | 5.7 | 1.3 | 3.13 | 3.13 | 3.13 | 3.13 | 3.13 |
| Total Cash | 12.3 | 12.5 | 13.3 | 20.1 | 16.1 | 20.7 | 23.1 | 25.8 | 28.9 | 32.3 |
| Total Cash, percent | .0 | .0 | .0 | .0 | .0 | .0 | .0 | .0 | .0 | .0 |
| Account Receivables | 39.5 | 45.5 | 54.8 | 52.2 | 58.9 | 69.7 | 78.0 | 87.1 | 97.4 | 108.9 |
| Account Receivables, % | 18.07 | 18.71 | 19.77 | 17.69 | 17.3 | 18.31 | 18.31 | 18.31 | 18.31 | 18.31 |
| Inventories | 115.0 | 127.1 | 131.9 | 130.5 | 152.0 | 183.9 | 205.6 | 229.8 | 256.9 | 287.2 |
| Inventories, % | 52.6 | 52.33 | 47.64 | 44.21 | 44.59 | 48.27 | 48.27 | 48.27 | 48.27 | 48.27 |
| Accounts Payable | 31.0 | 28.5 | 36.5 | 32.6 | 38.7 | 46.9 | 52.4 | 58.6 | 65.5 | 73.2 |
| Accounts Payable, % | 14.19 | 11.75 | 13.18 | 11.04 | 11.37 | 12.31 | 12.31 | 12.31 | 12.31 | 12.31 |
| Capital Expenditure | -4.5 | -4.7 | -7.9 | -8.7 | -15.2 | -10.9 | -12.1 | -13.6 | -15.2 | -17.0 |
| Capital Expenditure, % | -2.04 | -1.95 | -2.86 | -2.95 | -4.45 | -2.85 | -2.85 | -2.85 | -2.85 | -2.85 |
| Tax Rate, % | 207.07 | 207.07 | 207.07 | 207.07 | 207.07 | 207.07 | 207.07 | 207.07 | 207.07 | 207.07 |
| EBITAT | -22.6 | 12.2 | 12.0 | 12.0 | -4.7 | 7.8 | 8.7 | 9.7 | 10.9 | 12.2 |
| Depreciation | ||||||||||
| Changes in Account Receivables | ||||||||||
| Changes in Inventories | ||||||||||
| Changes in Accounts Payable | ||||||||||
| Capital Expenditure | ||||||||||
| UFCF | -139.3 | -3.5 | 7.3 | 13.4 | -27.0 | -22.3 | -10.6 | -11.8 | -13.2 | -14.8 |
| WACC, % | 6.81 | 6.64 | 6.52 | 6.52 | 5.79 | 6.45 | 6.45 | 6.45 | 6.45 | 6.45 |
| PV UFCF | ||||||||||
| SUM PV UFCF | -61.2 | |||||||||
| Long Term Growth Rate, % | 3.50 | |||||||||
| Free cash flow (T + 1) | -15 | |||||||||
| Terminal Value | -518 | |||||||||
| Present Terminal Value | -379 | |||||||||
| Enterprise Value | -440 | |||||||||
| Net Debt | 33 | |||||||||
| Equity Value | -474 | |||||||||
| Diluted Shares Outstanding, MM | 14 | |||||||||
| Equity Value Per Share | -34.18 |
What You Will Get
- Real TWIN Financial Data: Pre-filled with Twin Disc's historical and projected data for precise analysis.
- Fully Editable Template: Modify key inputs like revenue growth, WACC, and EBITDA % with ease.
- Automatic Calculations: See Twin Disc’s intrinsic value update instantly based on your changes.
- Professional Valuation Tool: Designed for investors, analysts, and consultants seeking accurate DCF results.
- User-Friendly Design: Simple structure and clear instructions for all experience levels.
Key Features
- Comprehensive DCF Calculator: Offers detailed unlevered and levered DCF valuation models tailored for Twin Disc, Incorporated (TWIN).
- WACC Calculator: Includes a pre-structured Weighted Average Cost of Capital sheet with adjustable inputs specific to (TWIN).
- Customizable Forecast Assumptions: Easily alter growth rates, capital expenditures, and discount rates for accurate projections.
- Integrated Financial Ratios: Evaluate profitability, leverage, and efficiency ratios relevant to Twin Disc, Incorporated (TWIN).
- Visual Dashboard and Charts: Graphical representations provide a summary of key valuation metrics for straightforward analysis.
How It Works
- Step 1: Download the Excel file.
- Step 2: Review Twin Disc, Incorporated’s pre-filled financial data and forecasts.
- Step 3: Modify critical inputs like revenue growth, WACC, and tax rates (highlighted cells).
- Step 4: Watch the DCF model update instantly as you tweak assumptions.
- Step 5: Analyze the outputs and use the results for investment decisions.
Why Choose This Calculator for Twin Disc, Incorporated (TWIN)?
- Accurate Data: Utilize real Twin Disc financials for dependable valuation outcomes.
- Customizable: Tailor essential parameters such as growth rates, WACC, and tax rates to align with your forecasts.
- Time-Saving: Ready-made calculations save you from having to build from the ground up.
- Professional-Grade Tool: Crafted for investors, analysts, and consultants in the industry.
- User-Friendly: Simple design and guided instructions ensure accessibility for all users.
Who Should Use This Product?
- Finance Students: Explore advanced valuation methods and apply them to real-world data for Twin Disc, Incorporated (TWIN).
- Academics: Integrate industry-standard models into your teaching or research focused on Twin Disc, Incorporated (TWIN).
- Investors: Validate your investment strategies and evaluate valuation metrics for Twin Disc, Incorporated (TWIN).
- Analysts: Enhance your analytical process with a ready-to-use, customizable DCF model for Twin Disc, Incorporated (TWIN).
- Small Business Owners: Understand the valuation practices used for large corporations like Twin Disc, Incorporated (TWIN).
What the Template Contains
- Preloaded TWIN Data: Historical and projected financial data, including revenue, EBIT, and capital expenditures.
- DCF and WACC Models: Professional-grade sheets for calculating intrinsic value and Weighted Average Cost of Capital.
- Editable Inputs: Yellow-highlighted cells for adjusting revenue growth, tax rates, and discount rates.
- Financial Statements: Comprehensive annual and quarterly financials for deeper analysis.
- Key Ratios: Profitability, leverage, and efficiency ratios to evaluate performance.
- Dashboard and Charts: Visual summaries of valuation outcomes and assumptions.
Disclaimer
All information, articles, and product details provided on this website are for general informational and educational purposes only. We do not claim any ownership over, nor do we intend to infringe upon, any trademarks, copyrights, logos, brand names, or other intellectual property mentioned or depicted on this site. Such intellectual property remains the property of its respective owners, and any references here are made solely for identification or informational purposes, without implying any affiliation, endorsement, or partnership.
We make no representations or warranties, express or implied, regarding the accuracy, completeness, or suitability of any content or products presented. Nothing on this website should be construed as legal, tax, investment, financial, medical, or other professional advice. In addition, no part of this site—including articles or product references—constitutes a solicitation, recommendation, endorsement, advertisement, or offer to buy or sell any securities, franchises, or other financial instruments, particularly in jurisdictions where such activity would be unlawful.
All content is of a general nature and may not address the specific circumstances of any individual or entity. It is not a substitute for professional advice or services. Any actions you take based on the information provided here are strictly at your own risk. You accept full responsibility for any decisions or outcomes arising from your use of this website and agree to release us from any liability in connection with your use of, or reliance upon, the content or products found herein.