
|
Ternium S.A (TX) تقييم DCF |
Fully Editable: Tailor To Your Needs In Excel Or Sheets
Professional Design: Trusted, Industry-Standard Templates
Investor-Approved Valuation Models
MAC/PC Compatible, Fully Unlocked
No Expertise Is Needed; Easy To Follow
Ternium S.A. (TX) Bundle
اكتشف القيمة الحقيقية لـ Ternium S.A (TX) مع حاسبة DCF المهنية! اضبط افتراضات المفتاح ، واستكشاف السيناريوهات المختلفة ، وقم بتقييم كيفية تأثير التغييرات على تقييم Ternium S.A (TX) - كل ذلك ضمن قالب Excel واحد.
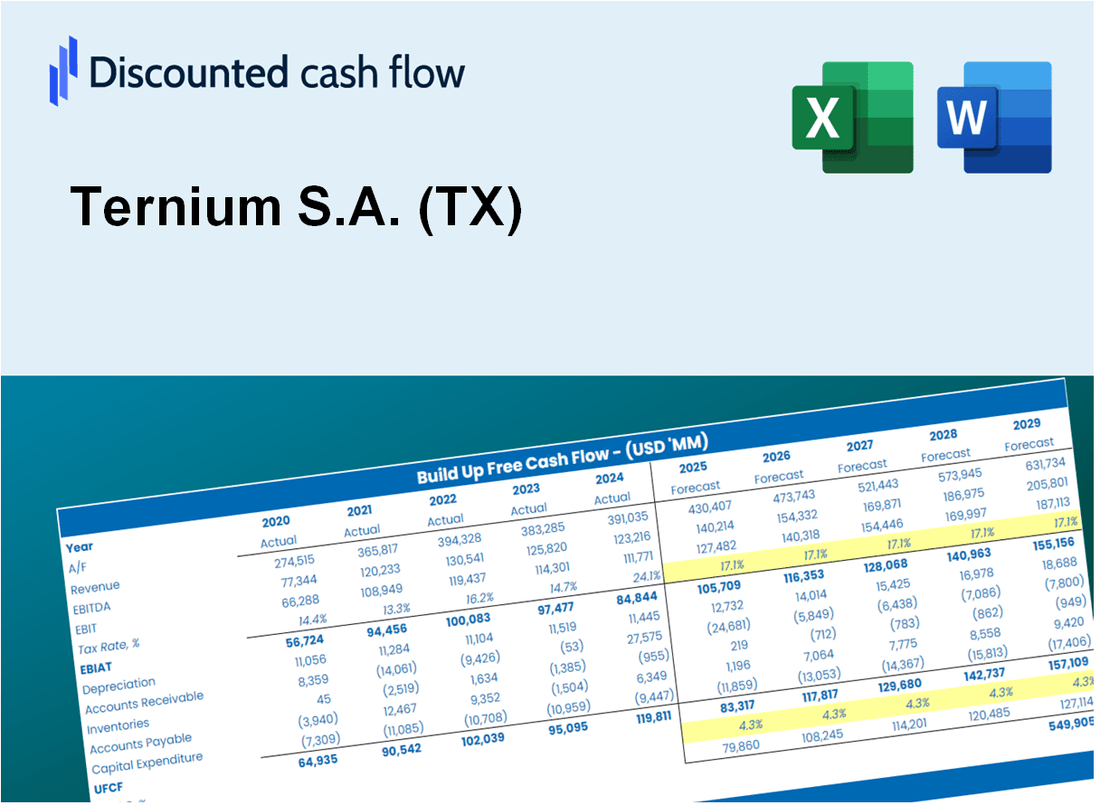
Discounted Cash Flow (DCF) - (USD MM)
| Year | AY1 2020 |
AY2 2021 |
AY3 2022 |
AY4 2023 |
AY5 2024 |
FY1 2025 |
FY2 2026 |
FY3 2027 |
FY4 2028 |
FY5 2029 |
|---|---|---|---|---|---|---|---|---|---|---|
| Revenue | 8,735.4 | 16,090.7 | 16,414.5 | 17,610.1 | 17,649.1 | 18,189.7 | 18,746.8 | 19,321.0 | 19,912.9 | 20,522.8 |
| Revenue Growth, % | 0 | 84.2 | 2.01 | 7.28 | 0.22128 | 3.06 | 3.06 | 3.06 | 3.06 | 3.06 |
| EBITDA | 1,774.8 | 5,958.0 | 3,329.7 | 2,209.2 | 1,877.7 | 3,667.6 | 3,779.9 | 3,895.7 | 4,015.0 | 4,138.0 |
| EBITDA, % | 20.32 | 37.03 | 20.29 | 12.54 | 10.64 | 20.16 | 20.16 | 20.16 | 20.16 | 20.16 |
| Depreciation | 629.4 | 589.4 | 620.7 | 657.7 | 642.5 | 801.2 | 825.8 | 851.1 | 877.1 | 904.0 |
| Depreciation, % | 7.2 | 3.66 | 3.78 | 3.73 | 3.64 | 4.4 | 4.4 | 4.4 | 4.4 | 4.4 |
| EBIT | 1,145.4 | 5,368.6 | 2,709.0 | 1,551.5 | 1,235.3 | 2,866.3 | 2,954.1 | 3,044.6 | 3,137.9 | 3,234.0 |
| EBIT, % | 13.11 | 33.36 | 16.5 | 8.81 | 7 | 15.76 | 15.76 | 15.76 | 15.76 | 15.76 |
| Total Cash | 1,351.4 | 2,567.0 | 3,528.4 | 3,821.7 | 3,848.6 | 3,507.9 | 3,615.4 | 3,726.1 | 3,840.2 | 3,957.9 |
| Total Cash, percent | .0 | .0 | .0 | .0 | .0 | .0 | .0 | .0 | .0 | .0 |
| Account Receivables | 943.1 | 1,767.2 | 1,180.7 | 3,175.7 | 2,388.0 | 2,202.3 | 2,269.7 | 2,339.2 | 2,410.9 | 2,484.7 |
| Account Receivables, % | 10.8 | 10.98 | 7.19 | 18.03 | 13.53 | 12.11 | 12.11 | 12.11 | 12.11 | 12.11 |
| Inventories | 2,001.8 | 3,908.3 | 3,470.2 | 4,948.4 | 4,750.5 | 4,487.8 | 4,625.3 | 4,767.0 | 4,913.0 | 5,063.5 |
| Inventories, % | 22.92 | 24.29 | 21.14 | 28.1 | 26.92 | 24.67 | 24.67 | 24.67 | 24.67 | 24.67 |
| Accounts Payable | 1,049.3 | 1,126.0 | 1,187.6 | 2,232.7 | 1,926.0 | 1,813.0 | 1,868.6 | 1,925.8 | 1,984.8 | 2,045.6 |
| Accounts Payable, % | 12.01 | 7 | 7.24 | 12.68 | 10.91 | 9.97 | 9.97 | 9.97 | 9.97 | 9.97 |
| Capital Expenditure | -560.0 | -523.6 | -580.6 | -1,460.7 | -1,865.4 | -1,166.5 | -1,202.3 | -1,239.1 | -1,277.0 | -1,316.2 |
| Capital Expenditure, % | -6.41 | -3.25 | -3.54 | -8.29 | -10.57 | -6.41 | -6.41 | -6.41 | -6.41 | -6.41 |
| Tax Rate, % | 107.37 | 107.37 | 107.37 | 107.37 | 107.37 | 107.37 | 107.37 | 107.37 | 107.37 | 107.37 |
| EBITAT | 769.1 | 3,562.5 | 1,795.7 | 794.1 | -91.1 | 1,438.8 | 1,482.8 | 1,528.2 | 1,575.1 | 1,623.3 |
| Depreciation | ||||||||||
| Changes in Account Receivables | ||||||||||
| Changes in Inventories | ||||||||||
| Changes in Accounts Payable | ||||||||||
| Capital Expenditure | ||||||||||
| UFCF | -1,057.1 | 974.4 | 2,922.0 | -2,437.0 | -635.1 | 1,408.9 | 956.9 | 986.3 | 1,016.5 | 1,047.6 |
| WACC, % | 6.57 | 6.52 | 6.52 | 5.58 | 2.41 | 5.52 | 5.52 | 5.52 | 5.52 | 5.52 |
| PV UFCF | ||||||||||
| SUM PV UFCF | 4,654.7 | |||||||||
| Long Term Growth Rate, % | 0.50 | |||||||||
| Free cash flow (T + 1) | 1,053 | |||||||||
| Terminal Value | 20,972 | |||||||||
| Present Terminal Value | 16,031 | |||||||||
| Enterprise Value | 20,686 | |||||||||
| Net Debt | 749 | |||||||||
| Equity Value | 19,937 | |||||||||
| Diluted Shares Outstanding, MM | 20 | |||||||||
| Equity Value Per Share | 1,015.59 |
What You Will Gain
- Authentic Ternium Data: Preloaded financial metrics – encompassing revenue to EBIT – derived from real and projected figures.
- Comprehensive Customization: Modify all essential parameters (yellow cells) such as WACC, growth %, and tax rates.
- Immediate Valuation Adjustments: Automatic recalculations to evaluate the effects of changes on Ternium’s fair value.
- Flexible Excel Template: Designed for quick modifications, scenario analysis, and in-depth projections.
- Efficient and Precise: Avoid building models from the ground up while ensuring accuracy and adaptability.
Key Features
- Accurate Ternium Financials: Gain access to precise pre-loaded historical data and future forecasts.
- Customizable Forecast Parameters: Modify yellow-highlighted cells such as WACC, growth rates, and profit margins.
- Real-Time Calculations: Automatic updates for DCF, Net Present Value (NPV), and cash flow assessments.
- Interactive Dashboard: User-friendly charts and summaries to help visualize your valuation findings.
- Designed for All Levels: An intuitive layout tailored for investors, CFOs, and consultants alike.
How It Works
- Download: Obtain the pre-built Excel file featuring Ternium S.A.'s (TX) financial data.
- Customize: Modify projections, including revenue growth, EBITDA %, and WACC.
- Update Automatically: The intrinsic value and NPV calculations refresh in real-time.
- Test Scenarios: Develop various forecasts and instantly compare the results.
- Make Decisions: Leverage the valuation findings to inform your investment strategy.
Why Choose This Calculator for Ternium S.A. (TX)?
- Accurate Data: Up-to-date Ternium financials provide trustworthy valuation outcomes.
- Customizable: Modify essential parameters such as growth rates, WACC, and tax rates to fit your forecasts.
- Time-Saving: Built-in calculations save you the hassle of starting from the ground up.
- Professional-Grade Tool: Tailored for investors, analysts, and consultants in the industry.
- User-Friendly: Clear layout and detailed instructions ensure ease of use for everyone.
Who Should Use This Product?
- Investors: Accurately estimate Ternium S.A.’s (TX) fair value before making investment decisions.
- CFOs: Leverage a professional-grade DCF model for financial reporting and analysis specific to Ternium S.A. (TX).
- Consultants: Quickly adapt the template for valuation reports tailored to Ternium S.A. (TX) for clients.
- Entrepreneurs: Gain insights into financial modeling practices employed by industry leaders like Ternium S.A. (TX).
- Educators: Use it as a teaching tool to illustrate valuation methodologies with a focus on Ternium S.A. (TX).
What the Ternium S.A. (TX) Template Contains
- Comprehensive DCF Model: Editable template featuring detailed valuation calculations tailored for Ternium S.A. (TX).
- Real-World Data: Ternium’s historical and projected financials preloaded for thorough analysis.
- Customizable Parameters: Modify WACC, growth rates, and tax assumptions to explore various scenarios.
- Financial Statements: Complete annual and quarterly breakdowns for enhanced insights into Ternium S.A. (TX).
- Key Ratios: Integrated analysis for profitability, efficiency, and leverage specific to Ternium S.A. (TX).
- Dashboard with Visual Outputs: Charts and tables providing clear, actionable results for decision-making.
Disclaimer
All information, articles, and product details provided on this website are for general informational and educational purposes only. We do not claim any ownership over, nor do we intend to infringe upon, any trademarks, copyrights, logos, brand names, or other intellectual property mentioned or depicted on this site. Such intellectual property remains the property of its respective owners, and any references here are made solely for identification or informational purposes, without implying any affiliation, endorsement, or partnership.
We make no representations or warranties, express or implied, regarding the accuracy, completeness, or suitability of any content or products presented. Nothing on this website should be construed as legal, tax, investment, financial, medical, or other professional advice. In addition, no part of this site—including articles or product references—constitutes a solicitation, recommendation, endorsement, advertisement, or offer to buy or sell any securities, franchises, or other financial instruments, particularly in jurisdictions where such activity would be unlawful.
All content is of a general nature and may not address the specific circumstances of any individual or entity. It is not a substitute for professional advice or services. Any actions you take based on the information provided here are strictly at your own risk. You accept full responsibility for any decisions or outcomes arising from your use of this website and agree to release us from any liability in connection with your use of, or reliance upon, the content or products found herein.