
|
Ucloudlink Group Inc. (UCL) تقييم DCF |
Fully Editable: Tailor To Your Needs In Excel Or Sheets
Professional Design: Trusted, Industry-Standard Templates
Investor-Approved Valuation Models
MAC/PC Compatible, Fully Unlocked
No Expertise Is Needed; Easy To Follow
uCloudlink Group Inc. (UCL) Bundle
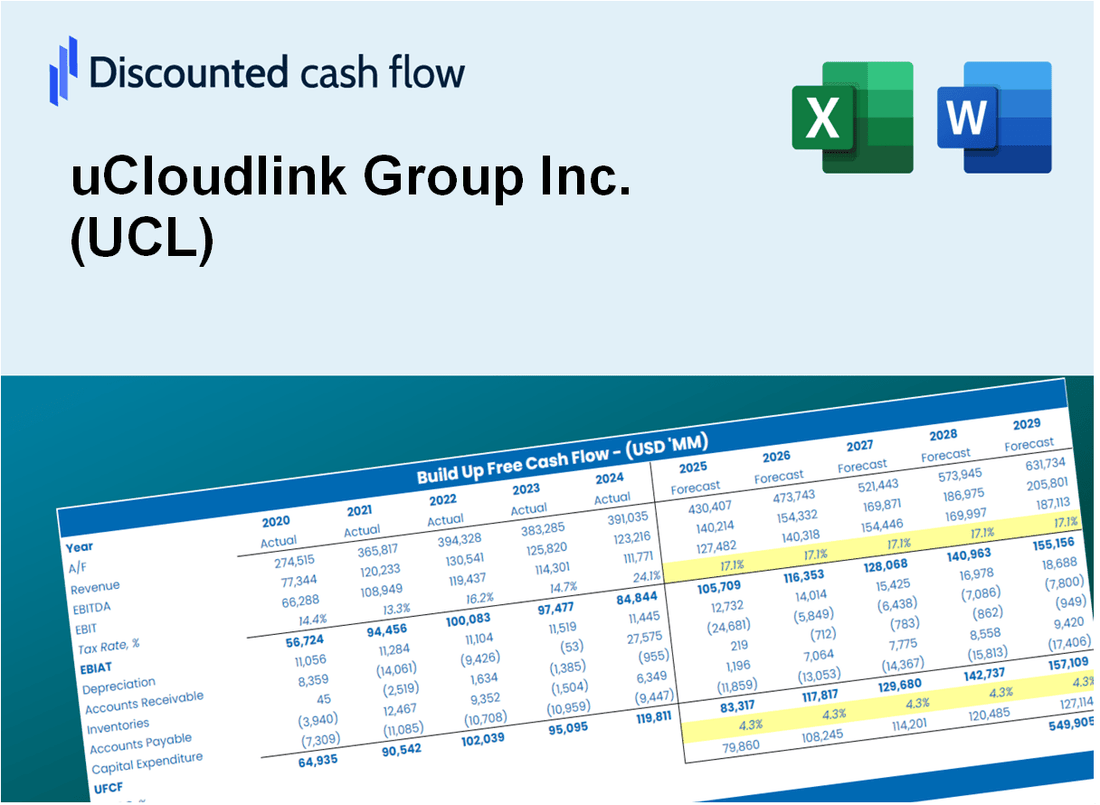
المصمم من أجل الدقة ، تمكنك حاسبة DCF الخاصة بـ UcloudLink Group Inc. (UCL) من تقييم تقييم UcloudLink باستخدام البيانات المالية في العالم الحقيقي وتوفر مرونة كاملة لتعديل جميع المعلمات الرئيسية للتوقعات المحسنة.
Discounted Cash Flow (DCF) - (USD MM)
| Year | AY1 2020 |
AY2 2021 |
AY3 2022 |
AY4 2023 |
AY5 2024 |
FY1 2025 |
FY2 2026 |
FY3 2027 |
FY4 2028 |
FY5 2029 |
|---|---|---|---|---|---|---|---|---|---|---|
| Revenue | 89.6 | 73.8 | 71.5 | 85.6 | 91.6 | 93.0 | 94.4 | 95.9 | 97.3 | 98.8 |
| Revenue Growth, % | 0 | -17.58 | -3.2 | 19.75 | 7.08 | 1.51 | 1.51 | 1.51 | 1.51 | 1.51 |
| EBITDA | -60.7 | -43.7 | -18.3 | 3.8 | 6.9 | -26.2 | -26.6 | -27.0 | -27.4 | -27.8 |
| EBITDA, % | -67.74 | -59.24 | -25.67 | 4.41 | 7.57 | -28.13 | -28.13 | -28.13 | -28.13 | -28.13 |
| Depreciation | 2.3 | 2.2 | 1.0 | 1.1 | 2.3 | 2.0 | 2.0 | 2.0 | 2.1 | 2.1 |
| Depreciation, % | 2.53 | 2.93 | 1.37 | 1.31 | 2.54 | 2.14 | 2.14 | 2.14 | 2.14 | 2.14 |
| EBIT | -62.9 | -45.9 | -19.3 | 2.7 | 4.6 | -28.2 | -28.6 | -29.0 | -29.5 | -29.9 |
| EBIT, % | -70.28 | -62.17 | -27.04 | 3.1 | 5.03 | -30.27 | -30.27 | -30.27 | -30.27 | -30.27 |
| Total Cash | 41.4 | 20.7 | 26.8 | 31.0 | 38.8 | 35.4 | 35.9 | 36.5 | 37.0 | 37.6 |
| Total Cash, percent | .0 | .0 | .0 | .0 | .0 | .0 | .0 | .0 | .0 | .0 |
| Account Receivables | 9.0 | 17.5 | 7.4 | 10.5 | 11.2 | 12.8 | 13.0 | 13.2 | 13.4 | 13.6 |
| Account Receivables, % | 10.06 | 23.77 | 10.32 | 12.26 | 12.22 | 13.73 | 13.73 | 13.73 | 13.73 | 13.73 |
| Inventories | 5.8 | 6.1 | 3.6 | 2.2 | 1.3 | 4.4 | 4.5 | 4.6 | 4.6 | 4.7 |
| Inventories, % | 6.53 | 8.31 | 5.07 | 2.55 | 1.43 | 4.78 | 4.78 | 4.78 | 4.78 | 4.78 |
| Accounts Payable | 8.7 | 13.0 | 6.8 | 5.3 | 7.4 | 9.5 | 9.7 | 9.8 | 10.0 | 10.1 |
| Accounts Payable, % | 9.71 | 17.59 | 9.56 | 6.21 | 8.12 | 10.24 | 10.24 | 10.24 | 10.24 | 10.24 |
| Capital Expenditure | -1.7 | -.9 | -.4 | -2.1 | -4.0 | -2.0 | -2.0 | -2.0 | -2.0 | -2.1 |
| Capital Expenditure, % | -1.94 | -1.19 | -0.59473 | -2.41 | -4.36 | -2.1 | -2.1 | -2.1 | -2.1 | -2.1 |
| Tax Rate, % | 1.47 | 1.47 | 1.47 | 1.47 | 1.47 | 1.47 | 1.47 | 1.47 | 1.47 | 1.47 |
| EBITAT | -63.1 | -46.1 | -19.5 | 2.6 | 4.5 | -27.9 | -28.4 | -28.8 | -29.2 | -29.7 |
| Depreciation | ||||||||||
| Changes in Account Receivables | ||||||||||
| Changes in Inventories | ||||||||||
| Changes in Accounts Payable | ||||||||||
| Capital Expenditure | ||||||||||
| UFCF | -68.8 | -49.4 | -12.4 | -1.5 | 5.2 | -30.5 | -28.4 | -28.9 | -29.3 | -29.8 |
| WACC, % | 5.39 | 5.39 | 5.39 | 5.31 | 5.34 | 5.36 | 5.36 | 5.36 | 5.36 | 5.36 |
| PV UFCF | ||||||||||
| SUM PV UFCF | -126.0 | |||||||||
| Long Term Growth Rate, % | 4.00 | |||||||||
| Free cash flow (T + 1) | -31 | |||||||||
| Terminal Value | -2,267 | |||||||||
| Present Terminal Value | -1,746 | |||||||||
| Enterprise Value | -1,872 | |||||||||
| Net Debt | -20 | |||||||||
| Equity Value | -1,851 | |||||||||
| Diluted Shares Outstanding, MM | 0 | |||||||||
| Equity Value Per Share | -4,919.42 |
What You Will Get
- Real UCL Financial Data: Pre-filled with uCloudlink Group Inc.'s historical and projected data for precise analysis.
- Fully Editable Template: Modify key inputs like revenue growth, WACC, and EBITDA % with ease.
- Automatic Calculations: See uCloudlink's intrinsic value update instantly based on your changes.
- Professional Valuation Tool: Designed for investors, analysts, and consultants seeking accurate DCF results.
- User-Friendly Design: Simple structure and clear instructions for all experience levels.
Key Features
- Comprehensive Financial Data: Gain access to precise historical data and future projections for uCloudlink Group Inc. (UCL).
- Adjustable Forecast Parameters: Modify highlighted fields such as WACC, growth rates, and profit margins.
- Real-time Calculations: Automatic updates for DCF, Net Present Value (NPV), and cash flow evaluations.
- User-Friendly Dashboard: Intuitive charts and summaries to help visualize your valuation outcomes.
- Designed for All Skill Levels: A straightforward layout tailored for investors, CFOs, and consultants alike.
How It Works
- Download the Template: Gain immediate access to the Excel-based UCL DCF Calculator.
- Input Your Assumptions: Modify the yellow-highlighted cells for growth rates, WACC, margins, and additional parameters.
- Instant Calculations: The model automatically recalculates uCloudlink’s intrinsic value.
- Test Scenarios: Experiment with various assumptions to assess potential valuation shifts.
- Analyze and Decide: Leverage the results to inform your investment or financial analysis.
Why Choose This Calculator for uCloudlink Group Inc. (UCL)?
- Accurate Data: Up-to-date financial information for uCloudlink ensures dependable valuation outcomes.
- Customizable: Tailor essential parameters such as growth rates, WACC, and tax rates to align with your forecasts.
- Time-Saving: Pre-configured calculations remove the hassle of starting from the ground up.
- Professional-Grade Tool: Crafted for investors, analysts, and consultants focusing on uCloudlink Group Inc. (UCL).
- User-Friendly: A clear layout and guided instructions make it accessible for all users.
Who Should Use uCloudlink Group Inc. (UCL)?
- Investors: Gain insights into the innovative technology sector with reliable data from uCloudlink.
- Market Analysts: Utilize comprehensive analytics to assess market trends and opportunities.
- Consultants: Tailor uCloudlink's offerings for impactful client strategies and presentations.
- Tech Enthusiasts: Explore the latest advancements in cloud technology and its applications.
- Educators and Students: Leverage real-world case studies from uCloudlink in technology and business courses.
What the Template Contains
- Pre-Filled Data: Includes uCloudlink Group Inc.'s (UCL) historical financials and forecasts.
- Discounted Cash Flow Model: Editable DCF valuation model with automatic calculations.
- Weighted Average Cost of Capital (WACC): A dedicated sheet for calculating WACC based on custom inputs.
- Key Financial Ratios: Analyze uCloudlink Group Inc.'s (UCL) profitability, efficiency, and leverage.
- Customizable Inputs: Edit revenue growth, margins, and tax rates with ease.
- Clear Dashboard: Charts and tables summarizing key valuation results.
Disclaimer
All information, articles, and product details provided on this website are for general informational and educational purposes only. We do not claim any ownership over, nor do we intend to infringe upon, any trademarks, copyrights, logos, brand names, or other intellectual property mentioned or depicted on this site. Such intellectual property remains the property of its respective owners, and any references here are made solely for identification or informational purposes, without implying any affiliation, endorsement, or partnership.
We make no representations or warranties, express or implied, regarding the accuracy, completeness, or suitability of any content or products presented. Nothing on this website should be construed as legal, tax, investment, financial, medical, or other professional advice. In addition, no part of this site—including articles or product references—constitutes a solicitation, recommendation, endorsement, advertisement, or offer to buy or sell any securities, franchises, or other financial instruments, particularly in jurisdictions where such activity would be unlawful.
All content is of a general nature and may not address the specific circumstances of any individual or entity. It is not a substitute for professional advice or services. Any actions you take based on the information provided here are strictly at your own risk. You accept full responsibility for any decisions or outcomes arising from your use of this website and agree to release us from any liability in connection with your use of, or reliance upon, the content or products found herein.