
|
تقييم Amerco (Uhal) DCF |
Fully Editable: Tailor To Your Needs In Excel Or Sheets
Professional Design: Trusted, Industry-Standard Templates
Investor-Approved Valuation Models
MAC/PC Compatible, Fully Unlocked
No Expertise Is Needed; Easy To Follow
AMERCO (UHAL) Bundle
تبسيط تحليلك وتحسين الدقة مع حاسبة (UHAL) DCF! مزودة ببيانات AMERCO الحقيقية والافتراضات القابلة للتخصيص ، تمكنك هذه الأداة من التنبؤ وتحليل وقيمة AMERCO مثل المستثمر المخضرم.
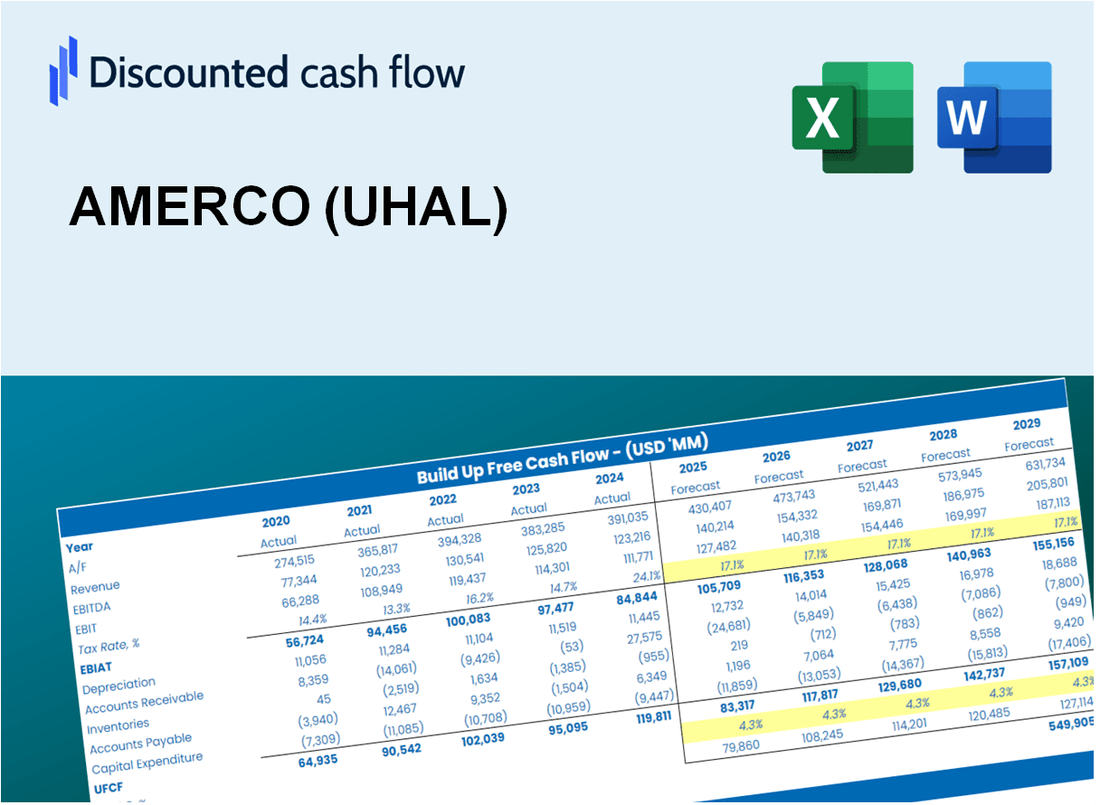
Discounted Cash Flow (DCF) - (USD MM)
| Year | AY1 2021 |
AY2 2022 |
AY3 2023 |
AY4 2024 |
AY5 2025 |
FY1 2026 |
FY2 2027 |
FY3 2028 |
FY4 2029 |
FY5 2030 |
|---|---|---|---|---|---|---|---|---|---|---|
| Revenue | 4,542.0 | 5,739.7 | 5,864.7 | 5,625.7 | 5,828.7 | 6,237.8 | 6,675.7 | 7,144.4 | 7,645.9 | 8,182.7 |
| Revenue Growth, % | 0 | 26.37 | 2.18 | -4.08 | 3.61 | 7.02 | 7.02 | 7.02 | 7.02 | 7.02 |
| EBITDA | 1,618.2 | 2,335.4 | 2,193.5 | 1,937.5 | 1,754.5 | 2,223.9 | 2,380.0 | 2,547.1 | 2,725.9 | 2,917.3 |
| EBITDA, % | 35.63 | 40.69 | 37.4 | 34.44 | 30.1 | 35.65 | 35.65 | 35.65 | 35.65 | 35.65 |
| Depreciation | 664.0 | 697.0 | 756.3 | 841.8 | 982.5 | 891.7 | 954.3 | 1,021.3 | 1,093.0 | 1,169.8 |
| Depreciation, % | 14.62 | 12.14 | 12.9 | 14.96 | 16.86 | 14.3 | 14.3 | 14.3 | 14.3 | 14.3 |
| EBIT | 954.2 | 1,638.4 | 1,437.1 | 1,095.6 | 772.0 | 1,332.2 | 1,425.7 | 1,525.8 | 1,632.9 | 1,747.5 |
| EBIT, % | 21.01 | 28.55 | 24.5 | 19.48 | 13.25 | 21.36 | 21.36 | 21.36 | 21.36 | 21.36 |
| Total Cash | 1,201.2 | 2,735.1 | 2,748.0 | 2,062.0 | 1,699.5 | 2,330.0 | 2,493.6 | 2,668.7 | 2,856.0 | 3,056.5 |
| Total Cash, percent | .0 | .0 | .0 | .0 | .0 | .0 | .0 | .0 | .0 | .0 |
| Account Receivables | 224.4 | 277.2 | 237.8 | 273.8 | 275.7 | 292.2 | 312.7 | 334.7 | 358.2 | 383.3 |
| Account Receivables, % | 4.94 | 4.83 | 4.05 | 4.87 | 4.73 | 4.68 | 4.68 | 4.68 | 4.68 | 4.68 |
| Inventories | 105.6 | 158.9 | 151.5 | 150.9 | 163.1 | 164.1 | 175.7 | 188.0 | 201.2 | 215.3 |
| Inventories, % | 2.32 | 2.77 | 2.58 | 2.68 | 2.8 | 2.63 | 2.63 | 2.63 | 2.63 | 2.63 |
| Accounts Payable | 645.6 | 677.8 | 235.9 | 240.1 | 263.3 | 484.4 | 518.4 | 554.8 | 593.8 | 635.4 |
| Accounts Payable, % | 14.21 | 11.81 | 4.02 | 4.27 | 4.52 | 7.77 | 7.77 | 7.77 | 7.77 | 7.77 |
| Capital Expenditure | -1,441.5 | -2,136.5 | -2,723.9 | -2,992.9 | -3,452.5 | -2,842.5 | -3,042.0 | -3,255.6 | -3,484.1 | -3,728.7 |
| Capital Expenditure, % | -31.74 | -37.22 | -46.45 | -53.2 | -59.23 | -45.57 | -45.57 | -45.57 | -45.57 | -45.57 |
| Tax Rate, % | 30.52 | 30.52 | 30.52 | 30.52 | 30.52 | 30.52 | 30.52 | 30.52 | 30.52 | 30.52 |
| EBITAT | 731.7 | 1,247.3 | 1,049.8 | 778.4 | 536.4 | 976.2 | 1,044.7 | 1,118.0 | 1,196.5 | 1,280.5 |
| Depreciation | ||||||||||
| Changes in Account Receivables | ||||||||||
| Changes in Inventories | ||||||||||
| Changes in Accounts Payable | ||||||||||
| Capital Expenditure | ||||||||||
| UFCF | 269.8 | -266.1 | -1,312.9 | -1,404.0 | -1,924.4 | -770.9 | -1,041.0 | -1,114.1 | -1,192.3 | -1,276.0 |
| WACC, % | 6.61 | 6.61 | 6.55 | 6.52 | 6.49 | 6.56 | 6.56 | 6.56 | 6.56 | 6.56 |
| PV UFCF | ||||||||||
| SUM PV UFCF | -4,414.8 | |||||||||
| Long Term Growth Rate, % | 2.00 | |||||||||
| Free cash flow (T + 1) | -1,302 | |||||||||
| Terminal Value | -28,560 | |||||||||
| Present Terminal Value | -20,790 | |||||||||
| Enterprise Value | -25,205 | |||||||||
| Net Debt | 6,252 | |||||||||
| Equity Value | -31,457 | |||||||||
| Diluted Shares Outstanding, MM | 196 | |||||||||
| Equity Value Per Share | -160.43 |
What You Will Receive
- Adjustable Forecast Parameters: Effortlessly modify assumptions (growth %, margins, WACC) to explore various scenarios.
- Comprehensive Financial Data: AMERCO’s financial information pre-loaded to facilitate your analysis.
- Automated DCF Calculations: The template computes Net Present Value (NPV) and intrinsic value automatically.
- Professional and Customizable: A refined Excel model that aligns with your valuation requirements.
- Designed for Analysts and Investors: Perfect for evaluating projections, confirming strategies, and enhancing efficiency.
Key Features
- Customizable Financial Inputs: Adjust essential metrics such as revenue growth, EBITDA %, and capital expenditures for AMERCO (UHAL).
- Instant DCF Valuation: Automatically computes intrinsic value, NPV, and other financial metrics for quick insights.
- High-Precision Accuracy: Leverages AMERCO's actual financial data to deliver realistic valuation results.
- Effortless Scenario Testing: Easily explore various assumptions and analyze different outcomes.
- Efficiency Booster: Avoid the hassle of creating intricate valuation models from the ground up.
How It Works
- Step 1: Download the prebuilt Excel template with AMERCO’s data included.
- Step 2: Explore the pre-filled sheets to familiarize yourself with the key metrics.
- Step 3: Update forecasts and assumptions in the editable yellow cells (WACC, growth, margins).
- Step 4: Instantly view recalculated results, including AMERCO’s intrinsic value.
- Step 5: Make informed investment decisions or generate reports using the outputs.
Why Choose This Calculator for AMERCO (UHAL)?
- Designed for Experts: A sophisticated tool utilized by financial analysts, CFOs, and industry consultants.
- Accurate Data: AMERCO’s historical and projected financials are preloaded for precise analysis.
- Forecast Simulation: Effortlessly test various scenarios and assumptions.
- Insightful Outputs: Automatically computes intrinsic value, NPV, and essential financial metrics.
- User-Friendly: Comprehensive step-by-step guidance simplifies the entire process.
Who Should Use This Product?
- Investors: Evaluate AMERCO's (UHAL) market position before making stock transactions.
- CFOs and Financial Analysts: Enhance valuation methodologies and assess financial forecasts.
- Startup Founders: Understand the valuation strategies of leading companies like AMERCO.
- Consultants: Create comprehensive valuation reports for clients based on AMERCO's data.
- Students and Educators: Utilize real-time data to practice and teach valuation concepts related to AMERCO.
What the Template Contains
- Preloaded UHAL Data: Historical and projected financial data, including revenue, EBIT, and capital expenditures.
- DCF and WACC Models: Professional-grade sheets for calculating intrinsic value and Weighted Average Cost of Capital.
- Editable Inputs: Yellow-highlighted cells for adjusting revenue growth, tax rates, and discount rates.
- Financial Statements: Comprehensive annual and quarterly financials for deeper analysis.
- Key Ratios: Profitability, leverage, and efficiency ratios to evaluate performance.
- Dashboard and Charts: Visual summaries of valuation outcomes and assumptions.
Disclaimer
All information, articles, and product details provided on this website are for general informational and educational purposes only. We do not claim any ownership over, nor do we intend to infringe upon, any trademarks, copyrights, logos, brand names, or other intellectual property mentioned or depicted on this site. Such intellectual property remains the property of its respective owners, and any references here are made solely for identification or informational purposes, without implying any affiliation, endorsement, or partnership.
We make no representations or warranties, express or implied, regarding the accuracy, completeness, or suitability of any content or products presented. Nothing on this website should be construed as legal, tax, investment, financial, medical, or other professional advice. In addition, no part of this site—including articles or product references—constitutes a solicitation, recommendation, endorsement, advertisement, or offer to buy or sell any securities, franchises, or other financial instruments, particularly in jurisdictions where such activity would be unlawful.
All content is of a general nature and may not address the specific circumstances of any individual or entity. It is not a substitute for professional advice or services. Any actions you take based on the information provided here are strictly at your own risk. You accept full responsibility for any decisions or outcomes arising from your use of this website and agree to release us from any liability in connection with your use of, or reliance upon, the content or products found herein.