
|
UnitedHealth Group Incorporated (UN) تقييم DCF |
Fully Editable: Tailor To Your Needs In Excel Or Sheets
Professional Design: Trusted, Industry-Standard Templates
Investor-Approved Valuation Models
MAC/PC Compatible, Fully Unlocked
No Expertise Is Needed; Easy To Follow
UnitedHealth Group Incorporated (UNH) Bundle
قم بتبسيط تحليلك وتحسين الدقة باستخدام حاسبة DCF التابعة لمجموعة UnitedHealth Group Incorporated (UNH)! باستخدام البيانات الحقيقية من UnitedHealth والافتراضات القابلة للتخصيص، تمكنك هذه الأداة من التنبؤ بـ UnitedHealth وتحليلها وتقديرها كمستثمر متمرس.
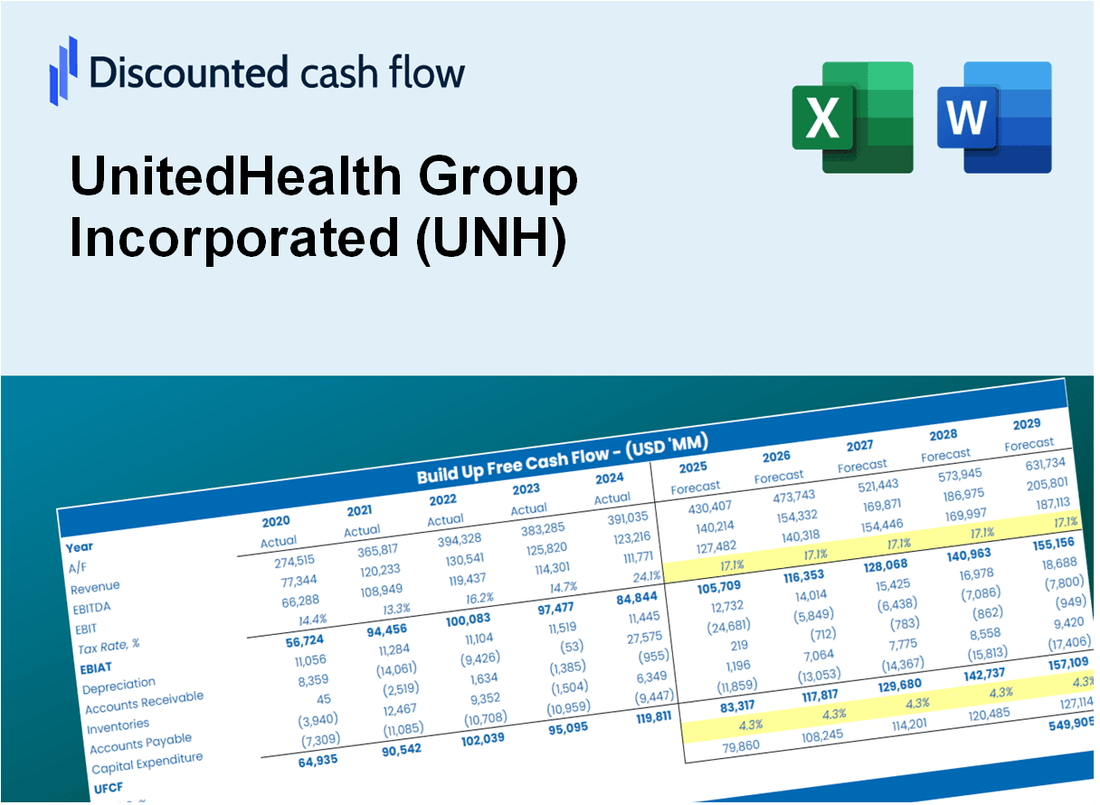
Discounted Cash Flow (DCF) - (USD MM)
| Year | AY1 2020 |
AY2 2021 |
AY3 2022 |
AY4 2023 |
AY5 2024 |
FY1 2025 |
FY2 2026 |
FY3 2027 |
FY4 2028 |
FY5 2029 |
|---|---|---|---|---|---|---|---|---|---|---|
| Revenue | 257,141.0 | 287,597.0 | 324,162.0 | 371,622.0 | 400,278.0 | 447,220.5 | 499,668.3 | 558,266.8 | 623,737.5 | 696,886.2 |
| Revenue Growth, % | 0 | 11.84 | 12.71 | 14.64 | 7.71 | 11.73 | 11.73 | 11.73 | 11.73 | 11.73 |
| EBITDA | 25,296.0 | 27,073.0 | 31,835.0 | 36,330.0 | 28,076.0 | 41,020.7 | 45,831.4 | 51,206.3 | 57,211.5 | 63,920.9 |
| EBITDA, % | 9.84 | 9.41 | 9.82 | 9.78 | 7.01 | 9.17 | 9.17 | 9.17 | 9.17 | 9.17 |
| Depreciation | 2,891.0 | 3,103.0 | 3,400.0 | 3,972.0 | 4,099.0 | 4,780.7 | 5,341.4 | 5,967.8 | 6,667.7 | 7,449.6 |
| Depreciation, % | 1.12 | 1.08 | 1.05 | 1.07 | 1.02 | 1.07 | 1.07 | 1.07 | 1.07 | 1.07 |
| EBIT | 22,405.0 | 23,970.0 | 28,435.0 | 32,358.0 | 23,977.0 | 36,240.0 | 40,490.0 | 45,238.4 | 50,543.8 | 56,471.3 |
| EBIT, % | 8.71 | 8.33 | 8.77 | 8.71 | 5.99 | 8.1 | 8.1 | 8.1 | 8.1 | 8.1 |
| Total Cash | 19,781.0 | 23,907.0 | 27,911.0 | 29,628.0 | 29,113.0 | 35,653.6 | 39,834.9 | 44,506.5 | 49,726.0 | 55,557.7 |
| Total Cash, percent | .0 | .0 | .0 | .0 | .0 | .0 | .0 | .0 | .0 | .0 |
| Account Receivables | 12,870.0 | 14,216.0 | 17,681.0 | 38,970.0 | 48,454.0 | 33,983.4 | 37,968.8 | 42,421.6 | 47,396.5 | 52,955.0 |
| Account Receivables, % | 5.01 | 4.94 | 5.45 | 10.49 | 12.11 | 7.6 | 7.6 | 7.6 | 7.6 | 7.6 |
| Inventories | .0 | .0 | .0 | .0 | .0 | .0 | .0 | .0 | .0 | .0 |
| Inventories, % | 0 | 0 | 0 | 0 | 0 | 0 | 0 | 0 | 0 | 0 |
| Accounts Payable | 44,367.0 | 49,126.0 | 56,771.0 | 31,958.0 | 68,561.0 | 69,387.7 | 77,525.1 | 86,616.9 | 96,774.9 | 108,124.1 |
| Accounts Payable, % | 17.25 | 17.08 | 17.51 | 8.6 | 17.13 | 15.52 | 15.52 | 15.52 | 15.52 | 15.52 |
| Capital Expenditure | -2,051.0 | -2,454.0 | -2,802.0 | -3,386.0 | -3,499.0 | -3,846.6 | -4,297.7 | -4,801.7 | -5,364.8 | -5,994.0 |
| Capital Expenditure, % | -0.79762 | -0.85328 | -0.86438 | -0.91114 | -0.87414 | -0.86011 | -0.86011 | -0.86011 | -0.86011 | -0.86011 |
| Tax Rate, % | 28.23 | 28.23 | 28.23 | 28.23 | 28.23 | 28.23 | 28.23 | 28.23 | 28.23 | 28.23 |
| EBITAT | 16,637.9 | 18,571.1 | 21,717.8 | 24,876.5 | 17,208.3 | 27,307.7 | 30,510.2 | 34,088.3 | 38,086.0 | 42,552.5 |
| Depreciation | ||||||||||
| Changes in Account Receivables | ||||||||||
| Changes in Inventories | ||||||||||
| Changes in Accounts Payable | ||||||||||
| Capital Expenditure | ||||||||||
| UFCF | 48,974.9 | 22,633.1 | 26,495.8 | -20,639.5 | 44,927.3 | 43,539.2 | 35,706.0 | 39,893.4 | 44,571.9 | 49,799.0 |
| WACC, % | 5.54 | 5.57 | 5.56 | 5.56 | 5.51 | 5.55 | 5.55 | 5.55 | 5.55 | 5.55 |
| PV UFCF | ||||||||||
| SUM PV UFCF | 181,154.5 | |||||||||
| Long Term Growth Rate, % | 2.00 | |||||||||
| Free cash flow (T + 1) | 50,795 | |||||||||
| Terminal Value | 1,431,294 | |||||||||
| Present Terminal Value | 1,092,598 | |||||||||
| Enterprise Value | 1,273,753 | |||||||||
| Net Debt | 51,592 | |||||||||
| Equity Value | 1,222,161 | |||||||||
| Diluted Shares Outstanding, MM | 929 | |||||||||
| Equity Value Per Share | 1,315.57 |
What You Will Get
- Real UNH Financials: Access to historical and projected data for precise valuation.
- Customizable Inputs: Adjust WACC, tax rates, revenue growth, and capital expenditures as needed.
- Instant Calculations: Intrinsic value and NPV are computed in real-time.
- Scenario Analysis: Evaluate various scenarios to assess UnitedHealth Group's future performance.
- User-Friendly Design: Designed for professionals while remaining approachable for newcomers.
Key Features
- Comprehensive Historical Data: UnitedHealth Group’s (UNH) past financial statements and pre-filled projections.
- Customizable Parameters: Adjust WACC, tax rates, revenue growth, and EBITDA margins as needed.
- Real-Time Calculations: Observe UnitedHealth Group’s intrinsic value update instantly.
- Intuitive Visualizations: Dashboard graphs illustrate valuation outcomes and essential metrics.
- Designed for Precision: A reliable tool tailored for analysts, investors, and finance professionals.
How It Works
- Download: Get the pre-prepared Excel file containing UnitedHealth Group's (UNH) financial data.
- Customize: Modify forecasts, including revenue growth, EBITDA %, and WACC.
- Update Automatically: The intrinsic value and NPV calculations refresh in real-time.
- Test Scenarios: Generate various projections and instantly compare results.
- Make Decisions: Leverage the valuation outcomes to inform your investment strategy.
Why Choose UnitedHealth Group (UNH)?
- Comprehensive Services: A wide range of healthcare solutions tailored to meet diverse needs.
- Proven Track Record: Years of experience in delivering quality health services and insurance.
- Innovative Technology: Cutting-edge tools and platforms enhance patient care and streamline operations.
- Commitment to Wellness: Focused on improving health outcomes and promoting preventative care.
- Industry Leadership: Recognized as a leader in the healthcare sector, trusted by millions.
Who Should Use This Product?
- Healthcare Investors: Develop comprehensive and accurate valuation models for portfolio management related to UnitedHealth Group (UNH).
- Corporate Finance Departments: Evaluate valuation scenarios to inform strategic decisions within their organizations.
- Consultants and Financial Advisors: Deliver precise valuation insights for clients interested in UnitedHealth Group (UNH) stock.
- Students and Academics: Utilize real-world data to enhance learning and teaching of financial modeling techniques.
- Health Sector Enthusiasts: Gain insights into how healthcare companies like UnitedHealth Group (UNH) are valued in the financial markets.
What the Template Contains
- Historical Data: Includes UnitedHealth Group's past financials and baseline forecasts.
- DCF and Levered DCF Models: Detailed templates to calculate UnitedHealth Group's intrinsic value.
- WACC Sheet: Pre-built calculations for Weighted Average Cost of Capital.
- Editable Inputs: Modify key drivers like growth rates, EBITDA %, and CAPEX assumptions.
- Quarterly and Annual Statements: A complete breakdown of UnitedHealth Group's financials.
- Interactive Dashboard: Visualize valuation results and projections dynamically.
Disclaimer
All information, articles, and product details provided on this website are for general informational and educational purposes only. We do not claim any ownership over, nor do we intend to infringe upon, any trademarks, copyrights, logos, brand names, or other intellectual property mentioned or depicted on this site. Such intellectual property remains the property of its respective owners, and any references here are made solely for identification or informational purposes, without implying any affiliation, endorsement, or partnership.
We make no representations or warranties, express or implied, regarding the accuracy, completeness, or suitability of any content or products presented. Nothing on this website should be construed as legal, tax, investment, financial, medical, or other professional advice. In addition, no part of this site—including articles or product references—constitutes a solicitation, recommendation, endorsement, advertisement, or offer to buy or sell any securities, franchises, or other financial instruments, particularly in jurisdictions where such activity would be unlawful.
All content is of a general nature and may not address the specific circumstances of any individual or entity. It is not a substitute for professional advice or services. Any actions you take based on the information provided here are strictly at your own risk. You accept full responsibility for any decisions or outcomes arising from your use of this website and agree to release us from any liability in connection with your use of, or reliance upon, the content or products found herein.