
|
United Therapeutics Corporation (UTR) تقييم DCF |
Fully Editable: Tailor To Your Needs In Excel Or Sheets
Professional Design: Trusted, Industry-Standard Templates
Investor-Approved Valuation Models
MAC/PC Compatible, Fully Unlocked
No Expertise Is Needed; Easy To Follow
United Therapeutics Corporation (UTHR) Bundle
كمستثمر أو محلل ، يعد هذا الحاسبة [الرمز] (UTHR) DCF المورد المثالي للتقييم الدقيق. محملة بالبيانات الحقيقية من شركة United Therapeutics Corporation ، يمكنك بسهولة ضبط التنبؤات ومراقبة التأثيرات في الوقت الفعلي.
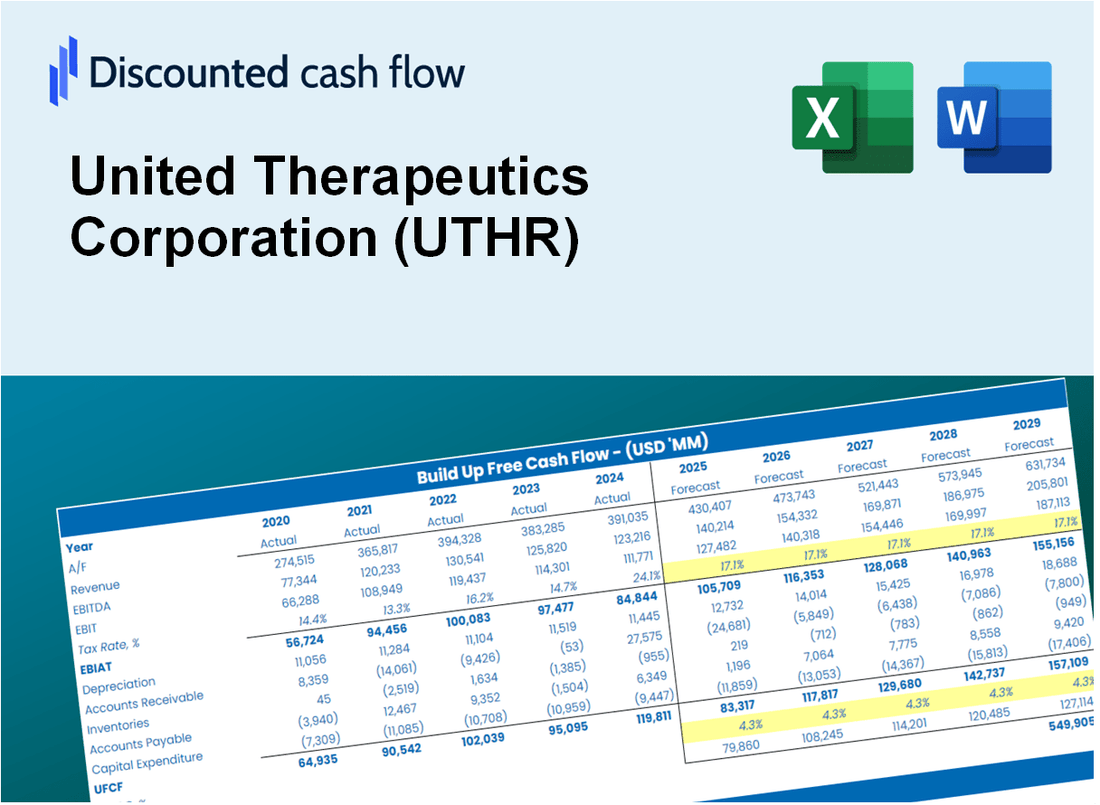
Discounted Cash Flow (DCF) - (USD MM)
| Year | AY1 2020 |
AY2 2021 |
AY3 2022 |
AY4 2023 |
AY5 2024 |
FY1 2025 |
FY2 2026 |
FY3 2027 |
FY4 2028 |
FY5 2029 |
|---|---|---|---|---|---|---|---|---|---|---|
| Revenue | 1,483.3 | 1,685.5 | 1,936.3 | 2,327.5 | 2,877.4 | 3,397.8 | 4,012.3 | 4,737.9 | 5,594.8 | 6,606.6 |
| Revenue Growth, % | 0 | 13.63 | 14.88 | 20.2 | 23.63 | 18.09 | 18.09 | 18.09 | 18.09 | 18.09 |
| EBITDA | 646.3 | 736.8 | 1,040.3 | 1,386.8 | 1,654.4 | 1,753.9 | 2,071.1 | 2,445.6 | 2,887.9 | 3,410.2 |
| EBITDA, % | 43.57 | 43.71 | 53.73 | 59.58 | 57.5 | 51.62 | 51.62 | 51.62 | 51.62 | 51.62 |
| Depreciation | 49.9 | 49.9 | 51.3 | 53.2 | 72.5 | 93.6 | 110.6 | 130.6 | 154.2 | 182.1 |
| Depreciation, % | 3.36 | 2.96 | 2.65 | 2.29 | 2.52 | 2.76 | 2.76 | 2.76 | 2.76 | 2.76 |
| EBIT | 596.4 | 686.9 | 989.0 | 1,333.6 | 1,581.9 | 1,660.2 | 1,960.5 | 2,315.1 | 2,733.8 | 3,228.2 |
| EBIT, % | 40.21 | 40.75 | 51.08 | 57.3 | 54.98 | 48.86 | 48.86 | 48.86 | 48.86 | 48.86 |
| Total Cash | 1,835.0 | 1,930.7 | 2,838.7 | 2,994.1 | 3,267.0 | 3,397.8 | 4,012.3 | 4,737.9 | 5,594.8 | 6,606.6 |
| Total Cash, percent | .0 | .0 | .0 | .0 | .0 | .0 | .0 | .0 | .0 | .0 |
| Account Receivables | 157.4 | 198.7 | 220.4 | 278.9 | 279.3 | 377.0 | 445.1 | 525.6 | 620.7 | 733.0 |
| Account Receivables, % | 10.61 | 11.79 | 11.38 | 11.98 | 9.71 | 11.09 | 11.09 | 11.09 | 11.09 | 11.09 |
| Inventories | 86.5 | 93.8 | 102.0 | 111.8 | 157.9 | 183.2 | 216.3 | 255.4 | 301.6 | 356.2 |
| Inventories, % | 5.83 | 5.57 | 5.27 | 4.8 | 5.49 | 5.39 | 5.39 | 5.39 | 5.39 | 5.39 |
| Accounts Payable | 4.1 | 3.8 | 4.1 | 5.6 | 6.0 | 7.9 | 9.3 | 11.0 | 13.0 | 15.4 |
| Accounts Payable, % | 0.27641 | 0.22545 | 0.21174 | 0.2406 | 0.20852 | 0.23255 | 0.23255 | 0.23255 | 0.23255 | 0.23255 |
| Capital Expenditure | -59.3 | -120.8 | -138.8 | -230.4 | -246.5 | -250.1 | -295.3 | -348.7 | -411.8 | -486.2 |
| Capital Expenditure, % | -4 | -7.17 | -7.17 | -9.9 | -8.57 | -7.36 | -7.36 | -7.36 | -7.36 | -7.36 |
| Tax Rate, % | 22.35 | 22.35 | 22.35 | 22.35 | 22.35 | 22.35 | 22.35 | 22.35 | 22.35 | 22.35 |
| EBITAT | 480.6 | 550.3 | 756.7 | 1,030.6 | 1,228.4 | 1,302.1 | 1,537.6 | 1,815.6 | 2,144.0 | 2,531.8 |
| Depreciation | ||||||||||
| Changes in Account Receivables | ||||||||||
| Changes in Inventories | ||||||||||
| Changes in Accounts Payable | ||||||||||
| Capital Expenditure | ||||||||||
| UFCF | 231.4 | 430.5 | 639.6 | 786.6 | 1,008.3 | 1,024.6 | 1,253.0 | 1,479.6 | 1,747.2 | 2,063.1 |
| WACC, % | 7.89 | 7.88 | 7.88 | 7.88 | 7.88 | 7.88 | 7.88 | 7.88 | 7.88 | 7.88 |
| PV UFCF | ||||||||||
| SUM PV UFCF | 5,906.5 | |||||||||
| Long Term Growth Rate, % | 2.00 | |||||||||
| Free cash flow (T + 1) | 2,104 | |||||||||
| Terminal Value | 35,782 | |||||||||
| Present Terminal Value | 24,487 | |||||||||
| Enterprise Value | 30,394 | |||||||||
| Net Debt | -1,397 | |||||||||
| Equity Value | 31,791 | |||||||||
| Diluted Shares Outstanding, MM | 49 | |||||||||
| Equity Value Per Share | 655.48 |
What You Will Receive
- Adjustable Forecast Variables: Modify key assumptions (growth %, profit margins, discount rate) to explore various scenarios.
- Comprehensive Data: United Therapeutics Corporation’s financial information pre-loaded to facilitate your analysis.
- Instant DCF Calculations: The template automatically computes Net Present Value (NPV) and intrinsic value for you.
- Tailored and Professional Design: A refined Excel model that meets your specific valuation requirements.
- Designed for Analysts and Investors: Perfect for evaluating forecasts, confirming strategies, and enhancing efficiency.
Key Features
- Real-Life UTHR Data: Pre-filled with United Therapeutics Corporation’s historical financials and future projections.
- Fully Customizable Inputs: Modify revenue growth, profit margins, WACC, tax rates, and capital expenditures as needed.
- Dynamic Valuation Model: Instant updates to Net Present Value (NPV) and intrinsic value based on your adjustments.
- Scenario Testing: Develop various forecast scenarios to evaluate different valuation results.
- User-Friendly Design: Intuitive, organized, and tailored for both professionals and newcomers.
How It Works
- Step 1: Download the Excel file.
- Step 2: Review United Therapeutics Corporation’s (UTHR) pre-filled financial data and forecasts.
- Step 3: Modify critical inputs like revenue growth, WACC, and tax rates (highlighted cells).
- Step 4: Watch the DCF model update instantly as you tweak assumptions.
- Step 5: Analyze the outputs and use the results for investment decisions.
Why Choose This Calculator for United Therapeutics Corporation (UTHR)?
- Accuracy: Utilizes real United Therapeutics financial data for precise calculations.
- Flexibility: Allows users to easily adjust and test various inputs.
- Time-Saving: Avoid the complexity of creating a DCF model from the ground up.
- Professional-Grade: Crafted with the precision and usability expected at the CFO level.
- User-Friendly: Intuitive design makes it accessible for users without extensive financial modeling skills.
Who Should Use This Product?
- Investors: Evaluate United Therapeutics Corporation’s (UTHR) fair value to inform investment choices.
- CFOs: Utilize a high-quality DCF model for accurate financial reporting and analysis.
- Consultants: Easily modify the template for client valuation reports specific to United Therapeutics Corporation (UTHR).
- Entrepreneurs: Discover financial modeling techniques employed by leading biotech firms.
- Educators: Implement it as an educational resource to illustrate valuation strategies.
What the Template Contains
- Pre-Filled DCF Model: United Therapeutics Corporation’s (UTHR) financial data preloaded for immediate use.
- WACC Calculator: Detailed calculations for Weighted Average Cost of Capital.
- Financial Ratios: Evaluate United Therapeutics Corporation’s (UTHR) profitability, leverage, and efficiency.
- Editable Inputs: Change assumptions such as growth, margins, and CAPEX to fit your scenarios.
- Financial Statements: Annual and quarterly reports to support detailed analysis.
- Interactive Dashboard: Easily visualize key valuation metrics and results.
Disclaimer
All information, articles, and product details provided on this website are for general informational and educational purposes only. We do not claim any ownership over, nor do we intend to infringe upon, any trademarks, copyrights, logos, brand names, or other intellectual property mentioned or depicted on this site. Such intellectual property remains the property of its respective owners, and any references here are made solely for identification or informational purposes, without implying any affiliation, endorsement, or partnership.
We make no representations or warranties, express or implied, regarding the accuracy, completeness, or suitability of any content or products presented. Nothing on this website should be construed as legal, tax, investment, financial, medical, or other professional advice. In addition, no part of this site—including articles or product references—constitutes a solicitation, recommendation, endorsement, advertisement, or offer to buy or sell any securities, franchises, or other financial instruments, particularly in jurisdictions where such activity would be unlawful.
All content is of a general nature and may not address the specific circumstances of any individual or entity. It is not a substitute for professional advice or services. Any actions you take based on the information provided here are strictly at your own risk. You accept full responsibility for any decisions or outcomes arising from your use of this website and agree to release us from any liability in connection with your use of, or reliance upon, the content or products found herein.