
|
Universal Technical Institute ، Inc. (UTI) DCF تقييم |
Fully Editable: Tailor To Your Needs In Excel Or Sheets
Professional Design: Trusted, Industry-Standard Templates
Investor-Approved Valuation Models
MAC/PC Compatible, Fully Unlocked
No Expertise Is Needed; Easy To Follow
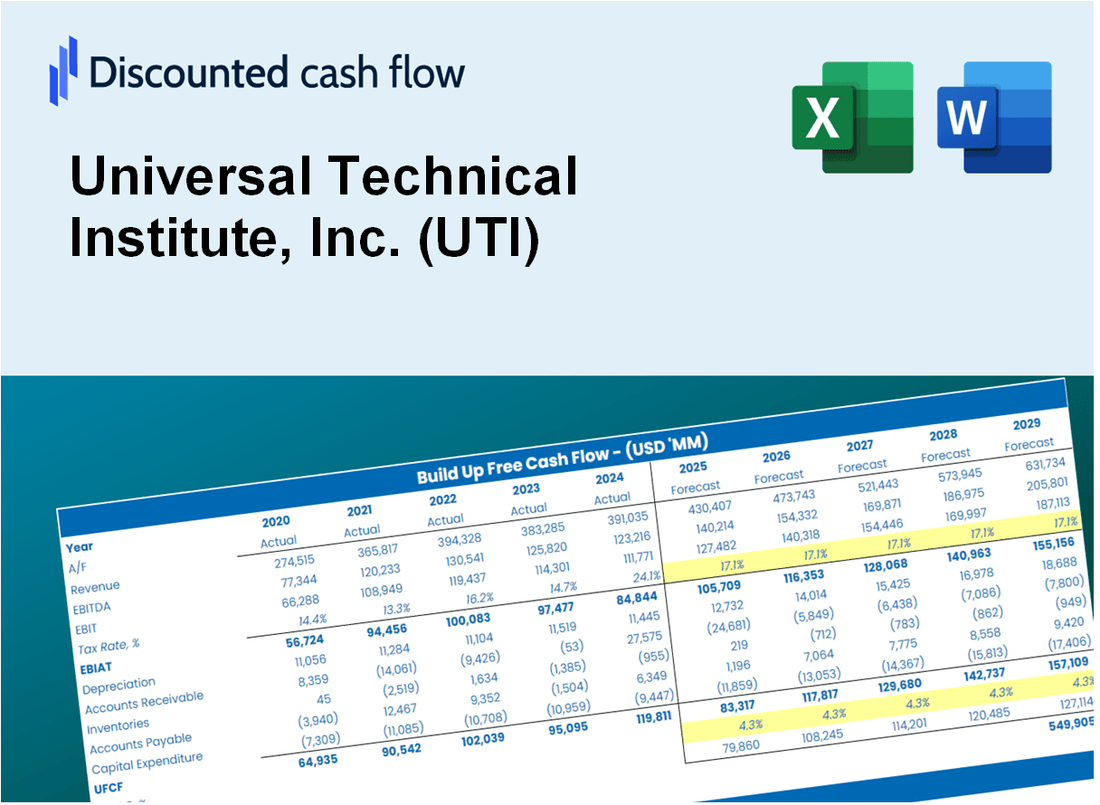
Universal Technical Institute, Inc. (UTI) Bundle
اكتساب رؤى حول تحليل التقييم العالمي للمعهد التقني (UTI) مع حاسبة DCF المتطورة! تم تحميله مسبقًا ببيانات UTI الحقيقية ، يمكّنك هذا القالب Excel من ضبط التنبؤات والافتراضات لتحديد القيمة الجوهرية للمعهد التقني العالمي بدقة (UTI).
What You Will Get
- Pre-Filled Financial Model: UTI’s actual data allows for accurate DCF valuation.
- Full Forecast Control: Modify enrollment growth, operating margins, WACC, and other essential factors.
- Instant Calculations: Automatic updates provide real-time results as you adjust inputs.
- Investor-Ready Template: A polished Excel file crafted for high-quality valuation.
- Customizable and Reusable: Designed for adaptability, enabling repeated use for comprehensive forecasts.
Key Features
- 🔍 Real-Life UTI Financials: Pre-filled historical and projected data for Universal Technical Institute, Inc. (UTI).
- ✏️ Fully Customizable Inputs: Adjust all critical parameters (yellow cells) like WACC, growth %, and tax rates.
- 📊 Professional DCF Valuation: Built-in formulas calculate UTI’s intrinsic value using the Discounted Cash Flow method.
- ⚡ Instant Results: Visualize UTI’s valuation instantly after making changes.
- Scenario Analysis: Test and compare outcomes for various financial assumptions side-by-side.
How It Works
- Download the Template: Gain immediate access to the Excel-based UTI (Universal Technical Institute, Inc.) DCF Calculator.
- Input Your Assumptions: Modify the yellow-highlighted cells for growth rates, WACC, margins, and other variables.
- Instant Calculations: The model automatically recalculates UTI's intrinsic value.
- Test Scenarios: Experiment with various assumptions to assess potential valuation impacts.
- Analyze and Decide: Use the findings to inform your investment or financial strategy.
Why Choose Universal Technical Institute (UTI)?
- Designed for Aspiring Technicians: A specialized program tailored for future automotive, diesel, and skilled trade professionals.
- Industry-Relevant Curriculum: Courses crafted with input from leading employers to ensure market readiness.
- Hands-On Training: Real-world experience with cutting-edge equipment and technology.
- Strong Job Placement Support: Comprehensive resources to help graduates secure employment in their field.
- Accessible Learning: Flexible scheduling options and financial aid available to support your education.
Who Should Use This Product?
- Students: Gain hands-on experience in technical training and prepare for a successful career.
- Employers: Find skilled graduates ready to meet the demands of the technical workforce.
- Career Changers: Acquire new skills to transition into in-demand technical fields.
- Instructors: Utilize industry-relevant curriculum to enhance teaching methods.
- Parents and Guardians: Explore educational opportunities for their children in technical careers.
What the Template Contains
- Comprehensive DCF Model: Editable template with detailed valuation calculations for Universal Technical Institute, Inc. (UTI).
- Real-World Data: UTI’s historical and projected financials preloaded for analysis.
- Customizable Parameters: Adjust WACC, growth rates, and tax assumptions to explore various scenarios.
- Financial Statements: Complete annual and quarterly breakdowns for deeper insights into UTI's performance.
- Key Ratios: Integrated analysis for profitability, efficiency, and leverage specific to UTI.
- Dashboard with Visual Outputs: Charts and tables for clear, actionable results tailored to UTI.
Disclaimer
All information, articles, and product details provided on this website are for general informational and educational purposes only. We do not claim any ownership over, nor do we intend to infringe upon, any trademarks, copyrights, logos, brand names, or other intellectual property mentioned or depicted on this site. Such intellectual property remains the property of its respective owners, and any references here are made solely for identification or informational purposes, without implying any affiliation, endorsement, or partnership.
We make no representations or warranties, express or implied, regarding the accuracy, completeness, or suitability of any content or products presented. Nothing on this website should be construed as legal, tax, investment, financial, medical, or other professional advice. In addition, no part of this site—including articles or product references—constitutes a solicitation, recommendation, endorsement, advertisement, or offer to buy or sell any securities, franchises, or other financial instruments, particularly in jurisdictions where such activity would be unlawful.
All content is of a general nature and may not address the specific circumstances of any individual or entity. It is not a substitute for professional advice or services. Any actions you take based on the information provided here are strictly at your own risk. You accept full responsibility for any decisions or outcomes arising from your use of this website and agree to release us from any liability in connection with your use of, or reliance upon, the content or products found herein.