
|
Veracyte ، Inc. (VCYT) DCF تقييم |
Fully Editable: Tailor To Your Needs In Excel Or Sheets
Professional Design: Trusted, Industry-Standard Templates
Investor-Approved Valuation Models
MAC/PC Compatible, Fully Unlocked
No Expertise Is Needed; Easy To Follow
Veracyte, Inc. (VCYT) Bundle
وفر الوقت وتحسين الدقة مع حاسبة (VCYT) DCF! من خلال بيانات Veracyte الحقيقية والافتراضات القابلة للتخصيص ، تمكنك هذه الأداة من التنبؤ وتحليل وقيمة Veracyte ، Inc. مثل المستثمر المخضرم.
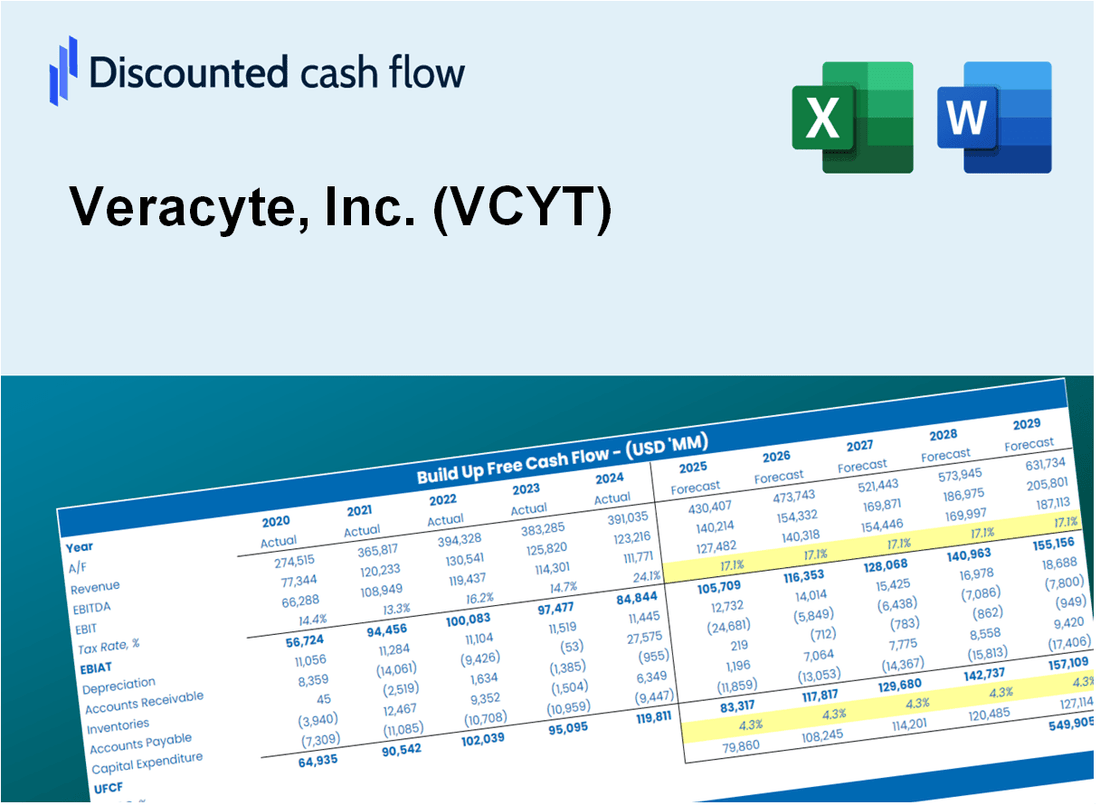
Discounted Cash Flow (DCF) - (USD MM)
| Year | AY1 2020 |
AY2 2021 |
AY3 2022 |
AY4 2023 |
AY5 2024 |
FY1 2025 |
FY2 2026 |
FY3 2027 |
FY4 2028 |
FY5 2029 |
|---|---|---|---|---|---|---|---|---|---|---|
| Revenue | 117.5 | 219.5 | 296.5 | 361.1 | 445.8 | 632.0 | 896.2 | 1,270.7 | 1,801.6 | 2,554.5 |
| Revenue Growth, % | 0 | 86.85 | 35.09 | 21.76 | 23.46 | 41.79 | 41.79 | 41.79 | 41.79 | 41.79 |
| EBITDA | -25.8 | -60.2 | -7.0 | -49.4 | 49.2 | -68.7 | -97.4 | -138.1 | -195.9 | -277.7 |
| EBITDA, % | -21.94 | -27.42 | -2.35 | -13.68 | 11.04 | -10.87 | -10.87 | -10.87 | -10.87 | -10.87 |
| Depreciation | 8.9 | 21.2 | 29.2 | 27.2 | 23.5 | 50.4 | 71.5 | 101.4 | 143.8 | 203.9 |
| Depreciation, % | 7.58 | 9.67 | 9.86 | 7.53 | 5.26 | 7.98 | 7.98 | 7.98 | 7.98 | 7.98 |
| EBIT | -34.7 | -81.4 | -36.2 | -76.6 | 25.7 | -119.2 | -168.9 | -239.5 | -339.7 | -481.6 |
| EBIT, % | -29.52 | -37.09 | -12.22 | -21.22 | 5.78 | -18.85 | -18.85 | -18.85 | -18.85 | -18.85 |
| Total Cash | 349.4 | 173.2 | 178.9 | 216.5 | 289.4 | 460.2 | 652.6 | 925.3 | 1,311.9 | 1,860.2 |
| Total Cash, percent | .0 | .0 | .0 | .0 | .0 | .0 | .0 | .0 | .0 | .0 |
| Account Receivables | 18.5 | 41.5 | 44.0 | 40.4 | 46.5 | 89.8 | 127.4 | 180.6 | 256.1 | 363.1 |
| Account Receivables, % | 15.71 | 18.89 | 14.85 | 11.18 | 10.44 | 14.21 | 14.21 | 14.21 | 14.21 | 14.21 |
| Inventories | 4.7 | 11.2 | 14.3 | 16.1 | 21.8 | 29.4 | 41.7 | 59.1 | 83.8 | 118.8 |
| Inventories, % | 3.96 | 5.11 | 4.82 | 4.47 | 4.88 | 4.65 | 4.65 | 4.65 | 4.65 | 4.65 |
| Accounts Payable | 3.1 | 12.4 | 11.9 | 12.9 | 8.6 | 22.5 | 31.9 | 45.3 | 64.2 | 91.1 |
| Accounts Payable, % | 2.65 | 5.63 | 4.02 | 3.58 | 1.94 | 3.56 | 3.56 | 3.56 | 3.56 | 3.56 |
| Capital Expenditure | -2.8 | -5.4 | -8.5 | -10.0 | -11.3 | -16.5 | -23.4 | -33.1 | -47.0 | -66.6 |
| Capital Expenditure, % | -2.41 | -2.45 | -2.88 | -2.76 | -2.53 | -2.61 | -2.61 | -2.61 | -2.61 | -2.61 |
| Tax Rate, % | 6.24 | 6.24 | 6.24 | 6.24 | 6.24 | 6.24 | 6.24 | 6.24 | 6.24 | 6.24 |
| EBITAT | -35.6 | -75.3 | -36.4 | -74.4 | 24.1 | -115.2 | -163.3 | -231.6 | -328.4 | -465.6 |
| Depreciation | ||||||||||
| Changes in Account Receivables | ||||||||||
| Changes in Inventories | ||||||||||
| Changes in Accounts Payable | ||||||||||
| Capital Expenditure | ||||||||||
| UFCF | -49.5 | -79.8 | -21.7 | -54.3 | 20.2 | -118.3 | -155.6 | -220.6 | -312.8 | -443.5 |
| WACC, % | 13.52 | 13.51 | 13.52 | 13.51 | 13.51 | 13.51 | 13.51 | 13.51 | 13.51 | 13.51 |
| PV UFCF | ||||||||||
| SUM PV UFCF | -799.5 | |||||||||
| Long Term Growth Rate, % | 2.00 | |||||||||
| Free cash flow (T + 1) | -452 | |||||||||
| Terminal Value | -3,929 | |||||||||
| Present Terminal Value | -2,085 | |||||||||
| Enterprise Value | -2,884 | |||||||||
| Net Debt | -188 | |||||||||
| Equity Value | -2,696 | |||||||||
| Diluted Shares Outstanding, MM | 78 | |||||||||
| Equity Value Per Share | -34.49 |
What You Will Get
- Editable Excel Template: A fully customizable Excel-based DCF Calculator featuring pre-filled real Veracyte, Inc. (VCYT) financials.
- Real-World Data: Historical data and forward-looking estimates (as indicated in the highlighted cells).
- Forecast Flexibility: Adjust forecast assumptions such as revenue growth, EBITDA %, and WACC.
- Automatic Calculations: Instantly observe how your inputs affect Veracyte, Inc. (VCYT)’s valuation.
- Professional Tool: Designed for investors, CFOs, consultants, and financial analysts.
- User-Friendly Design: Organized for clarity and ease of use, with comprehensive step-by-step instructions.
Key Features
- Comprehensive Veracyte Financials: Gain access to precise pre-loaded historical data and future forecasts.
- Adjustable Forecast Parameters: Modify highlighted cells such as WACC, growth rates, and profit margins.
- Real-Time Calculations: Automatic updates for DCF, Net Present Value (NPV), and cash flow assessments.
- Interactive Dashboard: User-friendly charts and summaries to illustrate your valuation outcomes.
- Designed for All Levels: An easy-to-navigate structure tailored for investors, CFOs, and consultants alike.
How It Works
- 1. Download the Template: Acquire and open the Excel file featuring Veracyte, Inc.'s preloaded data.
- 2. Modify Assumptions: Adjust key inputs such as growth rates, WACC, and capital expenditures to fit your analysis.
- 3. View Results in Real-Time: The DCF model automatically computes intrinsic value and NPV based on your inputs.
- 4. Explore Different Scenarios: Evaluate various forecasts to assess different valuation possibilities.
- 5. Present with Assurance: Share professional valuation findings to bolster your strategic decisions.
Why Choose This Calculator for Veracyte, Inc. (VCYT)?
- User-Friendly Interface: Perfect for both novices and seasoned professionals.
- Customizable Inputs: Adjust parameters easily to fit your specific analysis needs.
- Real-Time Feedback: Observe immediate updates to Veracyte’s valuation as you tweak inputs.
- Pre-Configured Data: Comes with Veracyte’s actual financial metrics for swift evaluation.
- Relied Upon by Experts: Favored by investors and analysts for making well-informed choices.
Who Should Use This Product?
- Healthcare Investors: Develop comprehensive and accurate valuation models for Veracyte, Inc. (VCYT) analysis.
- Biotech Finance Teams: Assess valuation scenarios to inform strategic decisions within the organization.
- Consultants and Advisors: Deliver precise valuation insights for clients interested in Veracyte, Inc. (VCYT).
- Students and Educators: Utilize real-world data to enhance learning and practice in financial modeling.
- Life Sciences Enthusiasts: Gain insights into how biotech companies like Veracyte, Inc. (VCYT) are valued in the marketplace.
What the Template Contains
- Pre-Filled DCF Model: Veracyte, Inc.’s (VCYT) financial data preloaded for immediate use.
- WACC Calculator: Detailed calculations for Weighted Average Cost of Capital.
- Financial Ratios: Evaluate Veracyte, Inc.’s (VCYT) profitability, leverage, and efficiency.
- Editable Inputs: Change assumptions such as growth, margins, and CAPEX to fit your scenarios.
- Financial Statements: Annual and quarterly reports to support detailed analysis.
- Interactive Dashboard: Easily visualize key valuation metrics and results.
Disclaimer
All information, articles, and product details provided on this website are for general informational and educational purposes only. We do not claim any ownership over, nor do we intend to infringe upon, any trademarks, copyrights, logos, brand names, or other intellectual property mentioned or depicted on this site. Such intellectual property remains the property of its respective owners, and any references here are made solely for identification or informational purposes, without implying any affiliation, endorsement, or partnership.
We make no representations or warranties, express or implied, regarding the accuracy, completeness, or suitability of any content or products presented. Nothing on this website should be construed as legal, tax, investment, financial, medical, or other professional advice. In addition, no part of this site—including articles or product references—constitutes a solicitation, recommendation, endorsement, advertisement, or offer to buy or sell any securities, franchises, or other financial instruments, particularly in jurisdictions where such activity would be unlawful.
All content is of a general nature and may not address the specific circumstances of any individual or entity. It is not a substitute for professional advice or services. Any actions you take based on the information provided here are strictly at your own risk. You accept full responsibility for any decisions or outcomes arising from your use of this website and agree to release us from any liability in connection with your use of, or reliance upon, the content or products found herein.