
|
Vertex ، Inc. (Verx) DCF تقييم |
Fully Editable: Tailor To Your Needs In Excel Or Sheets
Professional Design: Trusted, Industry-Standard Templates
Investor-Approved Valuation Models
MAC/PC Compatible, Fully Unlocked
No Expertise Is Needed; Easy To Follow
Vertex, Inc. (VERX) Bundle
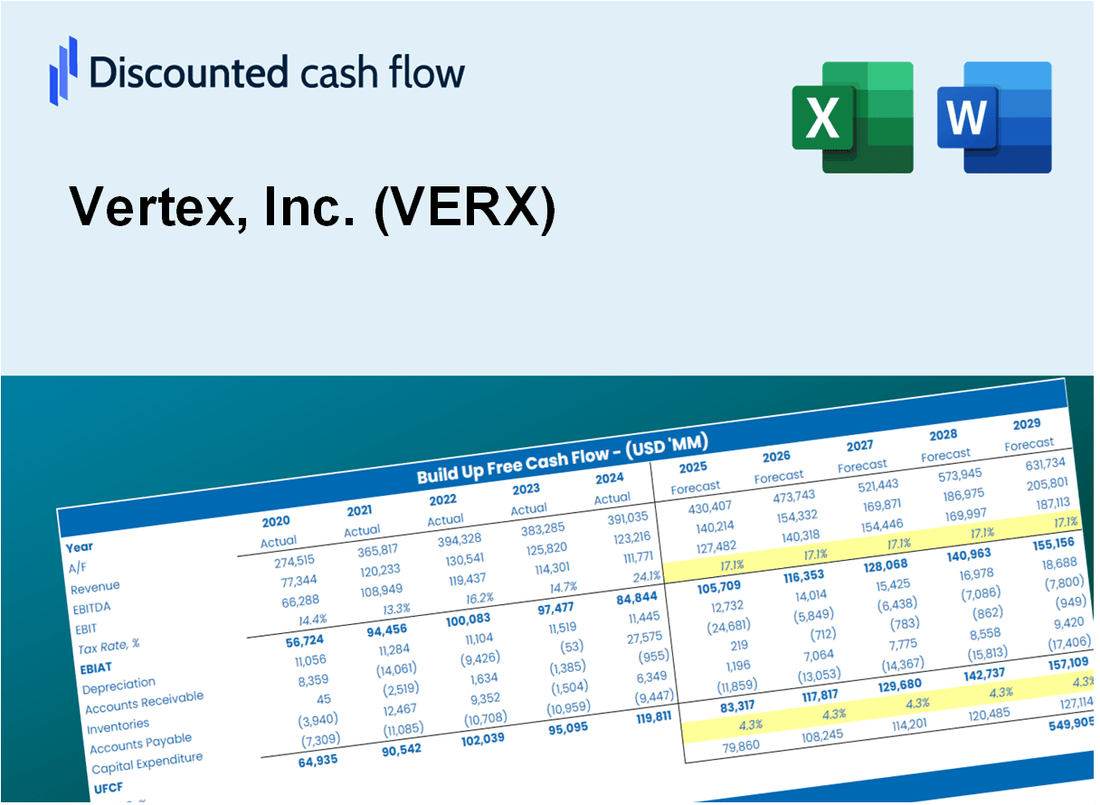
تم تصميم حاسبة DCF (VERX) للدقة، وتمكنك من تقييم تقييم Vertex، Inc. باستخدام البيانات المالية الفعلية وتوفر مرونة كاملة لتعديل جميع المعلمات الأساسية لتحسين التوقعات.
Discounted Cash Flow (DCF) - (USD MM)
| Year | AY1 2020 |
AY2 2021 |
AY3 2022 |
AY4 2023 |
AY5 2024 |
FY1 2025 |
FY2 2026 |
FY3 2027 |
FY4 2028 |
FY5 2029 |
|---|---|---|---|---|---|---|---|---|---|---|
| Revenue | 374.7 | 425.5 | 491.6 | 572.4 | 666.8 | 770.2 | 889.6 | 1,027.5 | 1,186.9 | 1,370.9 |
| Revenue Growth, % | 0 | 13.58 | 15.53 | 16.43 | 16.49 | 15.51 | 15.51 | 15.51 | 15.51 | 15.51 |
| EBITDA | -72.5 | 41.8 | 53.1 | 57.0 | 102.0 | 40.8 | 47.2 | 54.5 | 62.9 | 72.7 |
| EBITDA, % | -19.36 | 9.83 | 10.8 | 9.95 | 15.3 | 5.3 | 5.3 | 5.3 | 5.3 | 5.3 |
| Depreciation | 32.2 | 44.8 | 61.2 | 74.5 | 86.7 | 88.7 | 102.4 | 118.3 | 136.7 | 157.9 |
| Depreciation, % | 8.6 | 10.52 | 12.44 | 13.01 | 13.01 | 11.52 | 11.52 | 11.52 | 11.52 | 11.52 |
| EBIT | -104.8 | -2.9 | -8.1 | -17.5 | 15.3 | -47.8 | -55.3 | -63.8 | -73.7 | -85.2 |
| EBIT, % | -27.96 | -0.69134 | -1.64 | -3.06 | 2.29 | -6.21 | -6.21 | -6.21 | -6.21 | -6.21 |
| Total Cash | 303.1 | 73.3 | 103.0 | 77.7 | 305.2 | 274.8 | 317.4 | 366.7 | 423.5 | 489.2 |
| Total Cash, percent | .0 | .0 | .0 | .0 | .0 | .0 | .0 | .0 | .0 | .0 |
| Account Receivables | 77.2 | 76.9 | 102.9 | 141.8 | 164.4 | 167.9 | 194.0 | 224.1 | 258.8 | 298.9 |
| Account Receivables, % | 20.59 | 18.08 | 20.93 | 24.77 | 24.66 | 21.81 | 21.81 | 21.81 | 21.81 | 21.81 |
| Inventories | .0 | .0 | .0 | .0 | .0 | .0 | .0 | .0 | .0 | .0 |
| Inventories, % | 0 | 0 | 0 | 0 | 0 | 0 | 0 | 0 | 0 | 0 |
| Accounts Payable | 8.9 | 13.0 | 14.3 | 23.6 | 36.2 | 27.6 | 31.8 | 36.8 | 42.5 | 49.1 |
| Accounts Payable, % | 2.37 | 3.05 | 2.91 | 4.12 | 5.43 | 3.58 | 3.58 | 3.58 | 3.58 | 3.58 |
| Capital Expenditure | -32.8 | -43.4 | -60.4 | -68.2 | -65.8 | -81.7 | -94.3 | -109.0 | -125.9 | -145.4 |
| Capital Expenditure, % | -8.76 | -10.19 | -12.29 | -11.92 | -9.86 | -10.6 | -10.6 | -10.6 | -10.6 | -10.6 |
| Tax Rate, % | 2862.13 | 2862.13 | 2862.13 | 2862.13 | 2862.13 | 2862.13 | 2862.13 | 2862.13 | 2862.13 | 2862.13 |
| EBITAT | -72.9 | -1.1 | -9.8 | -10.6 | -421.8 | -25.6 | -29.6 | -34.2 | -39.5 | -45.6 |
| Depreciation | ||||||||||
| Changes in Account Receivables | ||||||||||
| Changes in Inventories | ||||||||||
| Changes in Accounts Payable | ||||||||||
| Capital Expenditure | ||||||||||
| UFCF | -141.8 | 4.7 | -33.7 | -33.9 | -410.9 | -30.8 | -43.2 | -50.0 | -57.7 | -66.6 |
| WACC, % | 6.45 | 6.33 | 6.57 | 6.42 | 6.19 | 6.39 | 6.39 | 6.39 | 6.39 | 6.39 |
| PV UFCF | ||||||||||
| SUM PV UFCF | -202.5 | |||||||||
| Long Term Growth Rate, % | 4.00 | |||||||||
| Free cash flow (T + 1) | -69 | |||||||||
| Terminal Value | -2,900 | |||||||||
| Present Terminal Value | -2,128 | |||||||||
| Enterprise Value | -2,330 | |||||||||
| Net Debt | 56 | |||||||||
| Equity Value | -2,386 | |||||||||
| Diluted Shares Outstanding, MM | 155 | |||||||||
| Equity Value Per Share | -15.39 |
What You Will Get
- Comprehensive VERX Financials: Access to both historical and projected data for precise valuation.
- Customizable Parameters: Adjust WACC, tax rates, revenue growth, and capital expenditures to fit your analysis.
- Real-Time Calculations: Intrinsic value and NPV are computed in real-time for immediate insights.
- Scenario Testing: Explore various scenarios to assess Vertex's future performance.
- User-Friendly Interface: Designed for professionals while remaining approachable for newcomers.
Key Features
- Customizable Financial Inputs: Adjust essential factors such as revenue projections, profit margins, and operational costs.
- Instant DCF Valuation: Automatically computes intrinsic value, NPV, and additional financial metrics.
- High-Precision Accuracy: Leverages Vertex, Inc.'s (VERX) actual financial data for dependable valuation results.
- Effortless Scenario Analysis: Easily explore various assumptions and evaluate their impact on outcomes.
- Efficiency Booster: Remove the hassle of constructing intricate valuation models from the ground up.
How It Works
- Download the Template: Gain immediate access to the Excel-based VERX DCF Calculator.
- Input Your Assumptions: Modify the yellow-highlighted cells for growth rates, WACC, margins, and more.
- Instant Calculations: The model automatically recalculates Vertex’s intrinsic value.
- Test Scenarios: Experiment with various assumptions to assess potential valuation changes.
- Analyze and Decide: Utilize the outcomes to inform your investment or financial analysis.
Why Choose Vertex's Calculator?
- Designed for Experts: A sophisticated tool utilized by financial analysts, CFOs, and industry consultants.
- Accurate Data: Vertex’s historical and forecasted financials are preloaded for precision.
- Flexible Scenario Analysis: Effortlessly test various forecasts and assumptions.
- Comprehensive Outputs: Automatically calculates intrinsic value, NPV, and essential financial metrics.
- User-Friendly: Step-by-step guidance ensures a smooth experience.
Who Should Use This Product?
- Investors: Accurately assess Vertex, Inc.'s (VERX) fair value prior to making investment choices.
- CFOs: Utilize a high-quality DCF model for financial reporting and analysis related to Vertex, Inc. (VERX).
- Consultants: Easily modify the template for valuation reports tailored to clients interested in Vertex, Inc. (VERX).
- Entrepreneurs: Acquire insights into financial modeling practices employed by leading companies like Vertex, Inc. (VERX).
- Educators: Implement it as an educational resource to illustrate valuation techniques with a focus on Vertex, Inc. (VERX).
What the Template Contains
- Pre-Filled DCF Model: Vertex, Inc.’s (VERX) financial data preloaded for immediate use.
- WACC Calculator: Detailed calculations for Weighted Average Cost of Capital.
- Financial Ratios: Evaluate Vertex, Inc.’s (VERX) profitability, leverage, and efficiency.
- Editable Inputs: Change assumptions such as growth, margins, and CAPEX to fit your scenarios.
- Financial Statements: Annual and quarterly reports to support detailed analysis.
- Interactive Dashboard: Easily visualize key valuation metrics and results.
Disclaimer
All information, articles, and product details provided on this website are for general informational and educational purposes only. We do not claim any ownership over, nor do we intend to infringe upon, any trademarks, copyrights, logos, brand names, or other intellectual property mentioned or depicted on this site. Such intellectual property remains the property of its respective owners, and any references here are made solely for identification or informational purposes, without implying any affiliation, endorsement, or partnership.
We make no representations or warranties, express or implied, regarding the accuracy, completeness, or suitability of any content or products presented. Nothing on this website should be construed as legal, tax, investment, financial, medical, or other professional advice. In addition, no part of this site—including articles or product references—constitutes a solicitation, recommendation, endorsement, advertisement, or offer to buy or sell any securities, franchises, or other financial instruments, particularly in jurisdictions where such activity would be unlawful.
All content is of a general nature and may not address the specific circumstances of any individual or entity. It is not a substitute for professional advice or services. Any actions you take based on the information provided here are strictly at your own risk. You accept full responsibility for any decisions or outcomes arising from your use of this website and agree to release us from any liability in connection with your use of, or reliance upon, the content or products found herein.