
|
ف. Corporation (VFC) تقييم DCF |
Fully Editable: Tailor To Your Needs In Excel Or Sheets
Professional Design: Trusted, Industry-Standard Templates
Investor-Approved Valuation Models
MAC/PC Compatible, Fully Unlocked
No Expertise Is Needed; Easy To Follow
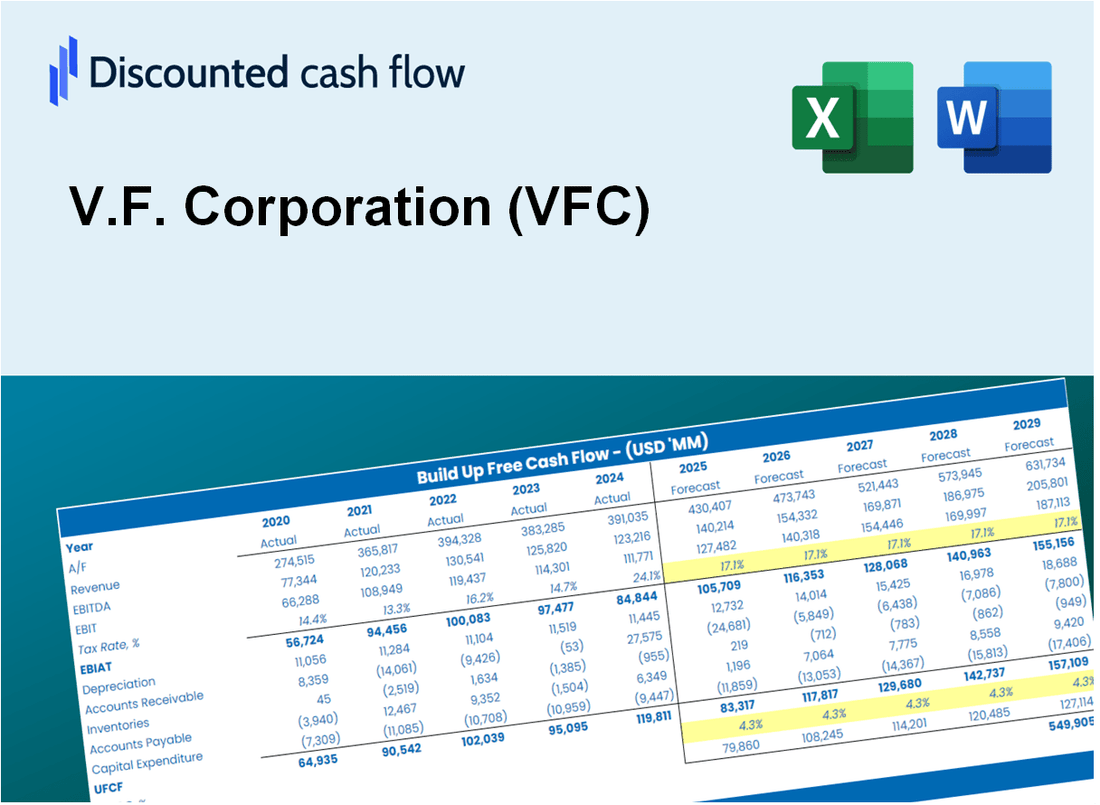
V.F. Corporation (VFC) Bundle
تبحث لتقييم v.f. القيمة الجوهرية للشركة؟ تدمج حاسبة V.F.C (VFC) DCF بيانات العالم الحقيقي مع ميزات تخصيص شاملة ، مما يتيح لك تحسين توقعاتك وتعزيز اختيارات الاستثمار الخاصة بك.
What You Will Get
- Editable Forecast Inputs: Easily modify assumptions (growth %, margins, WACC) to explore various scenarios.
- Real-World Data: V.F. Corporation’s (VFC) financial data pre-loaded to kickstart your analysis.
- Automatic DCF Outputs: The template computes Net Present Value (NPV) and intrinsic value for you.
- Customizable and Professional: A refined Excel model that adjusts to your valuation requirements.
- Built for Analysts and Investors: Perfect for evaluating projections, validating strategies, and enhancing efficiency.
Key Features
- Real-Life VFC Data: Pre-filled with V.F. Corporation’s historical financials and future projections.
- Fully Customizable Inputs: Modify revenue growth, profit margins, WACC, tax rates, and capital expenditures.
- Dynamic Valuation Model: Automatic adjustments to Net Present Value (NPV) and intrinsic value based on your inputs.
- Scenario Testing: Develop multiple forecasting scenarios to evaluate different valuation results.
- User-Friendly Design: Intuitive, organized, and suitable for both professionals and novices.
How It Works
- 1. Access the Template: Download and open the Excel file featuring V.F. Corporation (VFC)'s preloaded data.
- 2. Modify Assumptions: Adjust key inputs such as growth rates, WACC, and capital expenditures.
- 3. View Results Instantly: The DCF model automatically calculates intrinsic value and NPV.
- 4. Explore Scenarios: Analyze various forecasts to evaluate different valuation outcomes.
- 5. Present with Assurance: Showcase professional valuation insights to bolster your decision-making.
Why Choose This Calculator for V.F. Corporation (VFC)?
- Comprehensive Tool: Features DCF, WACC, and financial ratio analyses all in one convenient platform.
- Customizable Inputs: Modify yellow-highlighted cells to explore various financial scenarios.
- Detailed Insights: Automatically computes V.F. Corporation’s intrinsic value and Net Present Value.
- Preloaded Data: Historical and projected data provide reliable starting points for analysis.
- Professional Quality: Perfect for financial analysts, investors, and business consultants focusing on VFC.
Who Should Use This Product?
- Professional Investors: Develop comprehensive and accurate valuation models for portfolio management of V.F. Corporation (VFC).
- Corporate Finance Teams: Evaluate valuation scenarios to inform strategic decisions within the company.
- Consultants and Advisors: Offer clients precise valuation insights for V.F. Corporation (VFC) stock.
- Students and Educators: Utilize real-time data to enhance learning and practice in financial modeling.
- Fashion Industry Enthusiasts: Gain insights into how apparel companies like V.F. Corporation (VFC) are valued in the marketplace.
What the Template Contains
- Comprehensive DCF Model: Editable template featuring detailed valuation calculations tailored for V.F. Corporation (VFC).
- Real-World Data: V.F. Corporation’s historical and projected financials preloaded for in-depth analysis.
- Customizable Parameters: Modify WACC, growth rates, and tax assumptions to evaluate different scenarios.
- Financial Statements: Complete annual and quarterly breakdowns for enhanced insights into V.F. Corporation (VFC).
- Key Ratios: Integrated analysis for profitability, efficiency, and leverage specific to V.F. Corporation (VFC).
- Dashboard with Visual Outputs: Charts and tables designed to deliver clear, actionable results for V.F. Corporation (VFC).
Disclaimer
All information, articles, and product details provided on this website are for general informational and educational purposes only. We do not claim any ownership over, nor do we intend to infringe upon, any trademarks, copyrights, logos, brand names, or other intellectual property mentioned or depicted on this site. Such intellectual property remains the property of its respective owners, and any references here are made solely for identification or informational purposes, without implying any affiliation, endorsement, or partnership.
We make no representations or warranties, express or implied, regarding the accuracy, completeness, or suitability of any content or products presented. Nothing on this website should be construed as legal, tax, investment, financial, medical, or other professional advice. In addition, no part of this site—including articles or product references—constitutes a solicitation, recommendation, endorsement, advertisement, or offer to buy or sell any securities, franchises, or other financial instruments, particularly in jurisdictions where such activity would be unlawful.
All content is of a general nature and may not address the specific circumstances of any individual or entity. It is not a substitute for professional advice or services. Any actions you take based on the information provided here are strictly at your own risk. You accept full responsibility for any decisions or outcomes arising from your use of this website and agree to release us from any liability in connection with your use of, or reliance upon, the content or products found herein.