
|
Virnetx Holding Corp (VHC) DCF تقييم |
Fully Editable: Tailor To Your Needs In Excel Or Sheets
Professional Design: Trusted, Industry-Standard Templates
Investor-Approved Valuation Models
MAC/PC Compatible, Fully Unlocked
No Expertise Is Needed; Easy To Follow
VirnetX Holding Corp (VHC) Bundle
كمستثمر أو محلل، ستجد حاسبة VirnetX Holding Corp (VHC) DCF هذه موردًا أساسيًا للتقييم الدقيق. يأتي محملاً مسبقًا ببيانات حقيقية من VirnetX، مما يسمح لك بضبط التوقعات ومراقبة التأثيرات في الوقت الفعلي.
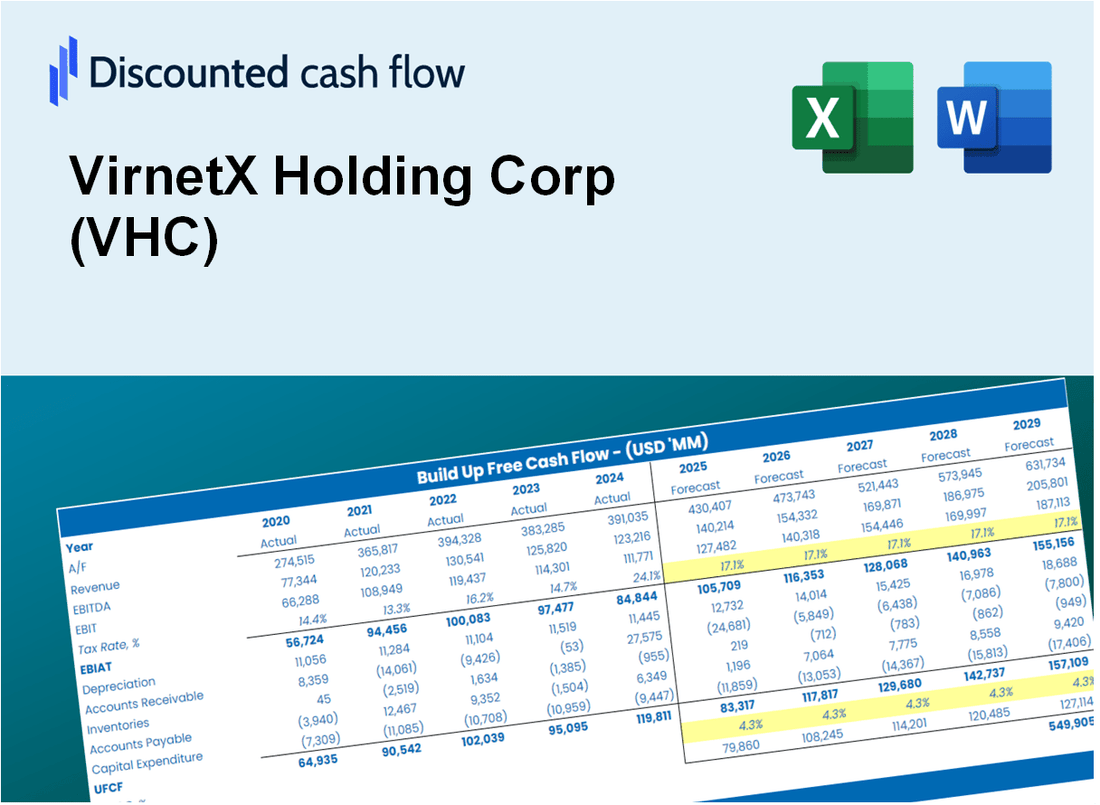
Discounted Cash Flow (DCF) - (USD MM)
| Year | AY1 2020 |
AY2 2021 |
AY3 2022 |
AY4 2023 |
AY5 2024 |
FY1 2025 |
FY2 2026 |
FY3 2027 |
FY4 2028 |
FY5 2029 |
|---|---|---|---|---|---|---|---|---|---|---|
| Revenue | 302.6 | .0 | .0 | .0 | .0 | .0 | .0 | .0 | .0 | .0 |
| Revenue Growth, % | 0 | -99.99 | 37.14 | -85.42 | -28.57 | -44.21 | -44.21 | -44.21 | -44.21 | -44.21 |
| EBITDA | 307.5 | -49.1 | -22.1 | -31.4 | -20.4 | .0 | .0 | .0 | .0 | .0 |
| EBITDA, % | 101.59 | -140348.57 | -45985.42 | -449085.71 | -407520 | -60 | -60 | -60 | -60 | -60 |
| Depreciation | .0 | .0 | .0 | .0 | .0 | .0 | .0 | .0 | .0 | .0 |
| Depreciation, % | 0.00165215 | 11.43 | 14.58 | 128.57 | 420 | 45.2 | 45.2 | 45.2 | 45.2 | 45.2 |
| EBIT | 307.5 | -49.1 | -22.1 | -31.4 | -20.4 | .0 | .0 | .0 | .0 | .0 |
| EBIT, % | 101.59 | -140360 | -46000 | -449214.29 | -407940 | -60 | -60 | -60 | -60 | -60 |
| Total Cash | 221.3 | 169.3 | 152.0 | 53.5 | 38.1 | .0 | .0 | .0 | .0 | .0 |
| Total Cash, percent | .0 | .5 | .3 | .8 | .8 | .0 | .0 | .0 | .0 | .0 |
| Account Receivables | .0 | .0 | .0 | .0 | .0 | .0 | .0 | .0 | .0 | .0 |
| Account Receivables, % | 0.00264344 | 48.57 | 29.17 | 28.57 | 0 | 21.26 | 21.26 | 21.26 | 21.26 | 21.26 |
| Inventories | .0 | .0 | .0 | .0 | .0 | .0 | .0 | .0 | .0 | .0 |
| Inventories, % | 0 | 0 | 0 | 0 | 0 | 0 | 0 | 0 | 0 | 0 |
| Accounts Payable | .7 | .3 | .4 | .4 | .3 | .0 | .0 | .0 | .0 | .0 |
| Accounts Payable, % | 0.2161 | 965.71 | 777.08 | 6285.71 | 6720 | 80.04 | 80.04 | 80.04 | 80.04 | 80.04 |
| Capital Expenditure | .0 | .0 | .0 | -.1 | .0 | .0 | .0 | .0 | .0 | .0 |
| Capital Expenditure, % | 0 | -31.43 | -22.92 | -928.57 | -440 | -50.87 | -50.87 | -50.87 | -50.87 | -50.87 |
| Tax Rate, % | -0.01650891 | -0.01650891 | -0.01650891 | -0.01650891 | -0.01650891 | -0.01650891 | -0.01650891 | -0.01650891 | -0.01650891 | -0.01650891 |
| EBITAT | 280.4 | -42.9 | -39.6 | -31.4 | -20.4 | .0 | .0 | .0 | .0 | .0 |
| Depreciation | ||||||||||
| Changes in Account Receivables | ||||||||||
| Changes in Inventories | ||||||||||
| Changes in Accounts Payable | ||||||||||
| Capital Expenditure | ||||||||||
| UFCF | 281.1 | -43.3 | -39.5 | -31.3 | -20.5 | -.3 | .0 | .0 | .0 | .0 |
| WACC, % | 12.49 | 12.48 | 12.52 | 12.52 | 12.52 | 12.51 | 12.51 | 12.51 | 12.51 | 12.51 |
| PV UFCF | ||||||||||
| SUM PV UFCF | -.3 | |||||||||
| Long Term Growth Rate, % | 2.00 | |||||||||
| Free cash flow (T + 1) | 0 | |||||||||
| Terminal Value | 0 | |||||||||
| Present Terminal Value | 0 | |||||||||
| Enterprise Value | 0 | |||||||||
| Net Debt | -23 | |||||||||
| Equity Value | 23 | |||||||||
| Diluted Shares Outstanding, MM | 4 | |||||||||
| Equity Value Per Share | 6.39 |
What You Will Get
- Real VirnetX Data: Preloaded financials – from revenue to EBIT – based on actual and projected figures.
- Full Customization: Adjust all critical parameters (yellow cells) like WACC, growth %, and tax rates.
- Instant Valuation Updates: Automatic recalculations to analyze the impact of changes on VirnetX’s fair value.
- Versatile Excel Template: Tailored for quick edits, scenario testing, and detailed projections.
- Time-Saving and Accurate: Skip building models from scratch while maintaining precision and flexibility.
Key Features
- 🔍 Real-Life VHC Financials: Pre-filled historical and projected data for VirnetX Holding Corp (VHC).
- ✏️ Fully Customizable Inputs: Adjust all critical parameters (yellow cells) like WACC, growth %, and tax rates.
- 📊 Professional DCF Valuation: Built-in formulas calculate VirnetX's intrinsic value using the Discounted Cash Flow method.
- ⚡ Instant Results: Visualize VirnetX's valuation instantly after making changes.
- Scenario Analysis: Test and compare outcomes for various financial assumptions side-by-side.
How It Works
- 1. Access the Model: Download and open the Excel template featuring VirnetX Holding Corp’s (VHC) financial data.
- 2. Adjust Key Variables: Modify essential inputs such as revenue growth rates, discount rates, and capital investments.
- 3. Analyze Results Immediately: The DCF model automatically computes the intrinsic value and net present value (NPV).
- 4. Explore Different Scenarios: Evaluate various forecasts to understand potential valuation variations.
- 5. Present with Assurance: Deliver expert valuation analysis to enhance your strategic decisions.
Why Choose This Calculator for VirnetX Holding Corp (VHC)?
- Accuracy: Utilizes authentic VirnetX financial data for precise calculations.
- Flexibility: Allows users to effortlessly adjust and experiment with inputs.
- Time-Saving: Eliminate the need to create a DCF model from the ground up.
- Professional-Grade: Crafted with the expertise and precision expected at the CFO level.
- User-Friendly: Intuitive design makes it accessible for users without extensive financial modeling skills.
Who Should Use This Product?
- Investors: Evaluate VirnetX Holding Corp’s (VHC) valuation before making stock transactions.
- CFOs and Financial Analysts: Enhance valuation methodologies and validate financial forecasts.
- Startup Founders: Understand the valuation strategies of established tech firms like VirnetX Holding Corp.
- Consultants: Provide detailed valuation analyses and reports for clients in the tech sector.
- Students and Educators: Utilize current market data to explore and teach valuation principles.
What the Template Contains
- Operating and Balance Sheet Data: Pre-filled VirnetX Holding Corp (VHC) historical data and forecasts, including revenue, EBITDA, EBIT, and capital expenditures.
- WACC Calculation: A dedicated sheet for Weighted Average Cost of Capital (WACC), including parameters like Beta, risk-free rate, and share price.
- DCF Valuation (Unlevered and Levered): Editable Discounted Cash Flow models showing intrinsic value with detailed calculations.
- Financial Statements: Pre-loaded financial statements (annual and quarterly) to support analysis.
- Key Ratios: Includes profitability, leverage, and efficiency ratios for VirnetX Holding Corp (VHC).
- Dashboard and Charts: Visual summary of valuation outputs and assumptions to analyze results easily.
Disclaimer
All information, articles, and product details provided on this website are for general informational and educational purposes only. We do not claim any ownership over, nor do we intend to infringe upon, any trademarks, copyrights, logos, brand names, or other intellectual property mentioned or depicted on this site. Such intellectual property remains the property of its respective owners, and any references here are made solely for identification or informational purposes, without implying any affiliation, endorsement, or partnership.
We make no representations or warranties, express or implied, regarding the accuracy, completeness, or suitability of any content or products presented. Nothing on this website should be construed as legal, tax, investment, financial, medical, or other professional advice. In addition, no part of this site—including articles or product references—constitutes a solicitation, recommendation, endorsement, advertisement, or offer to buy or sell any securities, franchises, or other financial instruments, particularly in jurisdictions where such activity would be unlawful.
All content is of a general nature and may not address the specific circumstances of any individual or entity. It is not a substitute for professional advice or services. Any actions you take based on the information provided here are strictly at your own risk. You accept full responsibility for any decisions or outcomes arising from your use of this website and agree to release us from any liability in connection with your use of, or reliance upon, the content or products found herein.