
|
Vista Energy ، S.A.B. دي سي. (VIST) تقييم DCF |
Fully Editable: Tailor To Your Needs In Excel Or Sheets
Professional Design: Trusted, Industry-Standard Templates
Investor-Approved Valuation Models
MAC/PC Compatible, Fully Unlocked
No Expertise Is Needed; Easy To Follow
Vista Energy, S.A.B. de C.V. (VIST) Bundle
تم تصميم حاسبة DCF الخاصة بنا (VIST) الخاصة بنا ، تمكنك من تقييم تقييم Vista Energy ، S.A.B. دي سي. من خلال البيانات المالية الحديثة والمرونة الكاملة لتعديل جميع المعلمات الأساسية للتوقعات المحسنة.
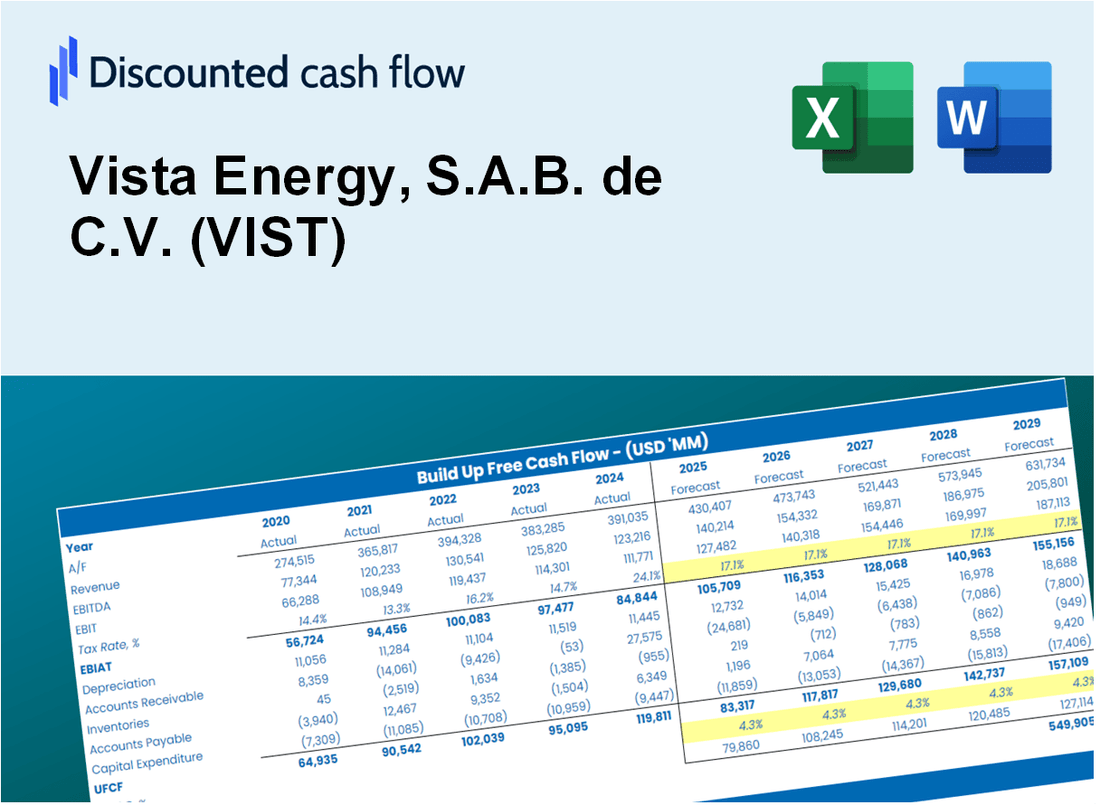
Discounted Cash Flow (DCF) - (USD MM)
| Year | AY1 2020 |
AY2 2021 |
AY3 2022 |
AY4 2023 |
AY5 2024 |
FY1 2025 |
FY2 2026 |
FY3 2027 |
FY4 2028 |
FY5 2029 |
|---|---|---|---|---|---|---|---|---|---|---|
| Revenue | 273.9 | 652.2 | 1,143.8 | 1,168.8 | 1,647.8 | 2,548.1 | 3,940.2 | 6,093.0 | 9,422.0 | 14,569.9 |
| Revenue Growth, % | 0 | 138.08 | 75.38 | 2.18 | 40.98 | 54.64 | 54.64 | 54.64 | 54.64 | 54.64 |
| EBITDA | 90.2 | 403.6 | 706.1 | 851.2 | 1,097.4 | 1,508.4 | 2,332.5 | 3,606.9 | 5,577.6 | 8,625.0 |
| EBITDA, % | 32.94 | 61.88 | 61.73 | 72.83 | 66.6 | 59.2 | 59.2 | 59.2 | 59.2 | 59.2 |
| Depreciation | 150.7 | 194.9 | 239.4 | 276.4 | 439.4 | 795.8 | 1,230.5 | 1,902.9 | 2,942.5 | 4,550.2 |
| Depreciation, % | 55.02 | 29.88 | 20.93 | 23.65 | 26.66 | 31.23 | 31.23 | 31.23 | 31.23 | 31.23 |
| EBIT | -60.5 | 208.7 | 466.7 | 574.8 | 658.1 | 712.6 | 1,101.9 | 1,704.0 | 2,635.0 | 4,074.7 |
| EBIT, % | -22.08 | 31.99 | 40.8 | 49.18 | 39.94 | 27.97 | 27.97 | 27.97 | 27.97 | 27.97 |
| Total Cash | 203.3 | 315.3 | 245.0 | 213.3 | 764.3 | 1,063.0 | 1,643.8 | 2,541.9 | 3,930.8 | 6,078.4 |
| Total Cash, percent | .0 | .0 | .0 | .0 | .0 | .0 | .0 | .0 | .0 | .0 |
| Account Receivables | 25.2 | 31.3 | 55.8 | 203.9 | 106.4 | 218.0 | 337.2 | 521.4 | 806.3 | 1,246.8 |
| Account Receivables, % | 9.21 | 4.79 | 4.88 | 17.44 | 6.46 | 8.56 | 8.56 | 8.56 | 8.56 | 8.56 |
| Inventories | 13.9 | 14.0 | 12.9 | 7.5 | 6.5 | 47.8 | 73.8 | 114.2 | 176.6 | 273.0 |
| Inventories, % | 5.06 | 2.14 | 1.13 | 0.64589 | 0.39259 | 1.87 | 1.87 | 1.87 | 1.87 | 1.87 |
| Accounts Payable | 117.4 | 119.3 | 196.5 | 204.7 | 435.8 | 623.2 | 963.6 | 1,490.1 | 2,304.3 | 3,563.3 |
| Accounts Payable, % | 42.86 | 18.29 | 17.18 | 17.51 | 26.45 | 24.46 | 24.46 | 24.46 | 24.46 | 24.46 |
| Capital Expenditure | -156.9 | -322.9 | -485.4 | -695.7 | -1,052.5 | -1,389.4 | -2,148.5 | -3,322.3 | -5,137.5 | -7,944.5 |
| Capital Expenditure, % | -57.28 | -49.51 | -42.44 | -59.53 | -63.88 | -54.53 | -54.53 | -54.53 | -54.53 | -54.53 |
| Tax Rate, % | 19.18 | 19.18 | 19.18 | 19.18 | 19.18 | 19.18 | 19.18 | 19.18 | 19.18 | 19.18 |
| EBITAT | -55.1 | 69.2 | 290.2 | 418.4 | 531.9 | 484.5 | 749.3 | 1,158.7 | 1,791.7 | 2,770.6 |
| Depreciation | ||||||||||
| Changes in Account Receivables | ||||||||||
| Changes in Inventories | ||||||||||
| Changes in Accounts Payable | ||||||||||
| Capital Expenditure | ||||||||||
| UFCF | 17.0 | -63.1 | 97.9 | -135.4 | 248.3 | -74.6 | 26.6 | 41.2 | 63.7 | 98.4 |
| WACC, % | 4.49 | 3.9 | 4.19 | 4.3 | 4.39 | 4.25 | 4.25 | 4.25 | 4.25 | 4.25 |
| PV UFCF | ||||||||||
| SUM PV UFCF | 123.1 | |||||||||
| Long Term Growth Rate, % | 2.00 | |||||||||
| Free cash flow (T + 1) | 100 | |||||||||
| Terminal Value | 4,454 | |||||||||
| Present Terminal Value | 3,617 | |||||||||
| Enterprise Value | 3,740 | |||||||||
| Net Debt | 789 | |||||||||
| Equity Value | 2,951 | |||||||||
| Diluted Shares Outstanding, MM | 103 | |||||||||
| Equity Value Per Share | 28.63 |
What You Will Get
- Editable Forecast Inputs: Easily modify key assumptions (growth %, margins, WACC) to explore various scenarios.
- Real-World Data: Vista Energy’s financial data pre-loaded to facilitate your analysis.
- Automatic DCF Outputs: The template computes Net Present Value (NPV) and intrinsic value automatically.
- Customizable and Professional: A refined Excel model that adjusts to your valuation requirements.
- Built for Analysts and Investors: Perfect for evaluating projections, confirming strategies, and enhancing efficiency.
Key Features
- 🔍 Real-Life VIST Financials: Pre-filled historical and projected data for Vista Energy, S.A.B. de C.V. (VIST).
- ✏️ Fully Customizable Inputs: Adjust all critical parameters (yellow cells) like WACC, growth %, and tax rates.
- 📊 Professional DCF Valuation: Built-in formulas calculate Vista Energy’s intrinsic value using the Discounted Cash Flow method.
- ⚡ Instant Results: Visualize Vista Energy’s valuation instantly after making changes.
- Scenario Analysis: Test and compare outcomes for various financial assumptions side-by-side.
How It Works
- Step 1: Download the Excel file.
- Step 2: Review pre-entered Vista Energy data (historical and projected).
- Step 3: Adjust key assumptions (yellow cells) based on your analysis.
- Step 4: View automatic recalculations for Vista Energy’s intrinsic value.
- Step 5: Use the outputs for investment decisions or reporting.
Why Choose Vista Energy (VIST)?
- Save Time: Quickly access essential energy data without building complex models.
- Enhance Precision: Utilize accurate metrics and insights to minimize valuation discrepancies.
- Fully Customizable: Adjust parameters to align with your energy market forecasts and strategies.
- User-Friendly Interface: Intuitive design and visualizations simplify data interpretation.
- Endorsed by Industry Leaders: Crafted for professionals who prioritize reliability and efficiency.
Who Should Use This Product?
- Investors: Assess Vista Energy's valuation before making stock transactions.
- CFOs and Financial Analysts: Enhance valuation workflows and evaluate financial forecasts.
- Startup Founders: Understand how large public companies like Vista Energy are appraised.
- Consultants: Provide comprehensive valuation reports for clients in the energy sector.
- Students and Educators: Utilize real-world data to learn and teach valuation methodologies.
What the Template Contains
- Historical Data: Includes Vista Energy's past financials and baseline forecasts.
- DCF and Levered DCF Models: Detailed templates to calculate Vista Energy's intrinsic value.
- WACC Sheet: Pre-built calculations for Weighted Average Cost of Capital.
- Editable Inputs: Modify key drivers like growth rates, EBITDA %, and CAPEX assumptions.
- Quarterly and Annual Statements: A complete breakdown of Vista Energy's financials.
- Interactive Dashboard: Visualize valuation results and projections dynamically.
Disclaimer
All information, articles, and product details provided on this website are for general informational and educational purposes only. We do not claim any ownership over, nor do we intend to infringe upon, any trademarks, copyrights, logos, brand names, or other intellectual property mentioned or depicted on this site. Such intellectual property remains the property of its respective owners, and any references here are made solely for identification or informational purposes, without implying any affiliation, endorsement, or partnership.
We make no representations or warranties, express or implied, regarding the accuracy, completeness, or suitability of any content or products presented. Nothing on this website should be construed as legal, tax, investment, financial, medical, or other professional advice. In addition, no part of this site—including articles or product references—constitutes a solicitation, recommendation, endorsement, advertisement, or offer to buy or sell any securities, franchises, or other financial instruments, particularly in jurisdictions where such activity would be unlawful.
All content is of a general nature and may not address the specific circumstances of any individual or entity. It is not a substitute for professional advice or services. Any actions you take based on the information provided here are strictly at your own risk. You accept full responsibility for any decisions or outcomes arising from your use of this website and agree to release us from any liability in connection with your use of, or reliance upon, the content or products found herein.