
|
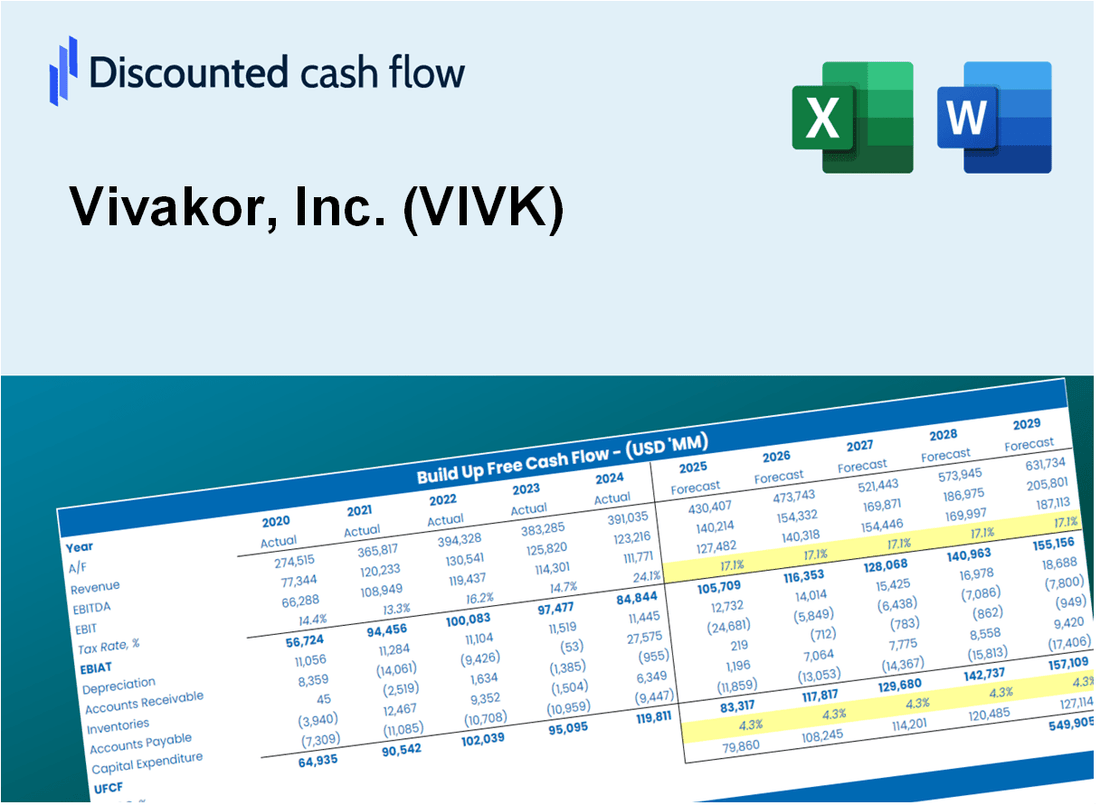
Vivakor ، Inc. (VIVK) DCF تقييم |
Fully Editable: Tailor To Your Needs In Excel Or Sheets
Professional Design: Trusted, Industry-Standard Templates
Investor-Approved Valuation Models
MAC/PC Compatible, Fully Unlocked
No Expertise Is Needed; Easy To Follow
Vivakor, Inc. (VIVK) Bundle
تقييم التوقعات المالية Vivakor ، Inc. (VIVK) مثل خبير! توفر حاسبة DCF هذه (VIVK) بيانات مالية مملوءة مسبقًا مع السماح لك بالمرونة لتعديل نمو الإيرادات ، WACC ، الهوامش ، وغيرها من الافتراضات الحاسمة التي تتماشى مع توقعاتك.
What You Will Get
- Real VIVK Financial Data: Pre-populated with Vivakor's historical and projected data for thorough analysis.
- Fully Editable Template: Easily adjust key inputs like revenue growth, WACC, and EBITDA %.
- Automatic Calculations: Watch Vivakor’s intrinsic value update in real-time as you make changes.
- Professional Valuation Tool: Tailored for investors, analysts, and consultants aiming for precise DCF results.
- User-Friendly Design: Intuitive layout and straightforward instructions suitable for all experience levels.
Key Features
- Pre-Loaded Data: Vivakor's historical financial statements and pre-filled forecasts.
- Fully Adjustable Inputs: Modify WACC, tax rates, revenue growth, and EBITDA margins.
- Instant Results: View Vivakor's intrinsic value recalculated in real time.
- Clear Visual Outputs: Dashboard charts showcase valuation results and key metrics.
- Built for Accuracy: A professional tool designed for analysts, investors, and finance experts.
How It Works
- Step 1: Download the Excel file.
- Step 2: Review pre-entered Vivakor, Inc. (VIVK) data (historical and projected).
- Step 3: Adjust key assumptions (yellow cells) based on your analysis.
- Step 4: View automatic recalculations for Vivakor, Inc. (VIVK)’s intrinsic value.
- Step 5: Use the outputs for investment decisions or reporting.
Why Choose Vivakor, Inc. (VIVK)?
- Innovative Solutions: Cutting-edge technology that sets us apart in the industry.
- Sustainable Practices: Commitment to environmentally friendly operations and products.
- Expert Team: Experienced professionals dedicated to delivering exceptional results.
- Proven Track Record: A history of success and reliability in our services and products.
- Customer-Centric Approach: Focused on meeting the unique needs of our clients.
Who Should Use This Product?
- Investors: Accurately assess Vivakor, Inc.'s (VIVK) fair value prior to making investment choices.
- CFOs: Utilize a high-quality DCF model for financial analysis and reporting.
- Consultants: Easily customize the template for client valuation reports.
- Entrepreneurs: Acquire knowledge on financial modeling practices employed by leading companies.
- Educators: Implement it as a resource for teaching valuation techniques.
What the Template Contains
- Pre-Filled Data: Contains Vivakor, Inc.’s historical financials and projections.
- Discounted Cash Flow Model: Editable DCF valuation model with automated calculations.
- Weighted Average Cost of Capital (WACC): A dedicated sheet for calculating WACC based on user-defined inputs.
- Key Financial Ratios: Evaluate Vivakor, Inc.’s profitability, efficiency, and leverage.
- Customizable Inputs: Easily modify revenue growth, margins, and tax rates.
- Clear Dashboard: Visualizations and tables summarizing essential valuation outcomes.
Disclaimer
All information, articles, and product details provided on this website are for general informational and educational purposes only. We do not claim any ownership over, nor do we intend to infringe upon, any trademarks, copyrights, logos, brand names, or other intellectual property mentioned or depicted on this site. Such intellectual property remains the property of its respective owners, and any references here are made solely for identification or informational purposes, without implying any affiliation, endorsement, or partnership.
We make no representations or warranties, express or implied, regarding the accuracy, completeness, or suitability of any content or products presented. Nothing on this website should be construed as legal, tax, investment, financial, medical, or other professional advice. In addition, no part of this site—including articles or product references—constitutes a solicitation, recommendation, endorsement, advertisement, or offer to buy or sell any securities, franchises, or other financial instruments, particularly in jurisdictions where such activity would be unlawful.
All content is of a general nature and may not address the specific circumstances of any individual or entity. It is not a substitute for professional advice or services. Any actions you take based on the information provided here are strictly at your own risk. You accept full responsibility for any decisions or outcomes arising from your use of this website and agree to release us from any liability in connection with your use of, or reliance upon, the content or products found herein.