
|
تقييم VolitionRx Limited (VNRX) DCF |
Fully Editable: Tailor To Your Needs In Excel Or Sheets
Professional Design: Trusted, Industry-Standard Templates
Investor-Approved Valuation Models
MAC/PC Compatible, Fully Unlocked
No Expertise Is Needed; Easy To Follow
VolitionRx Limited (VNRX) Bundle
اكتشف الإمكانات الحقيقية لـ FromitionRx Limited (VNRX) مع حاسبة DCF المتقدمة! اضبط الافتراضات الأساسية ، واستكشاف السيناريوهات المختلفة ، وتقييم تأثيرات التغييرات على تقييم PropitionRx Limited (VNRX) - كل ذلك ضمن قالب Excel واحد.
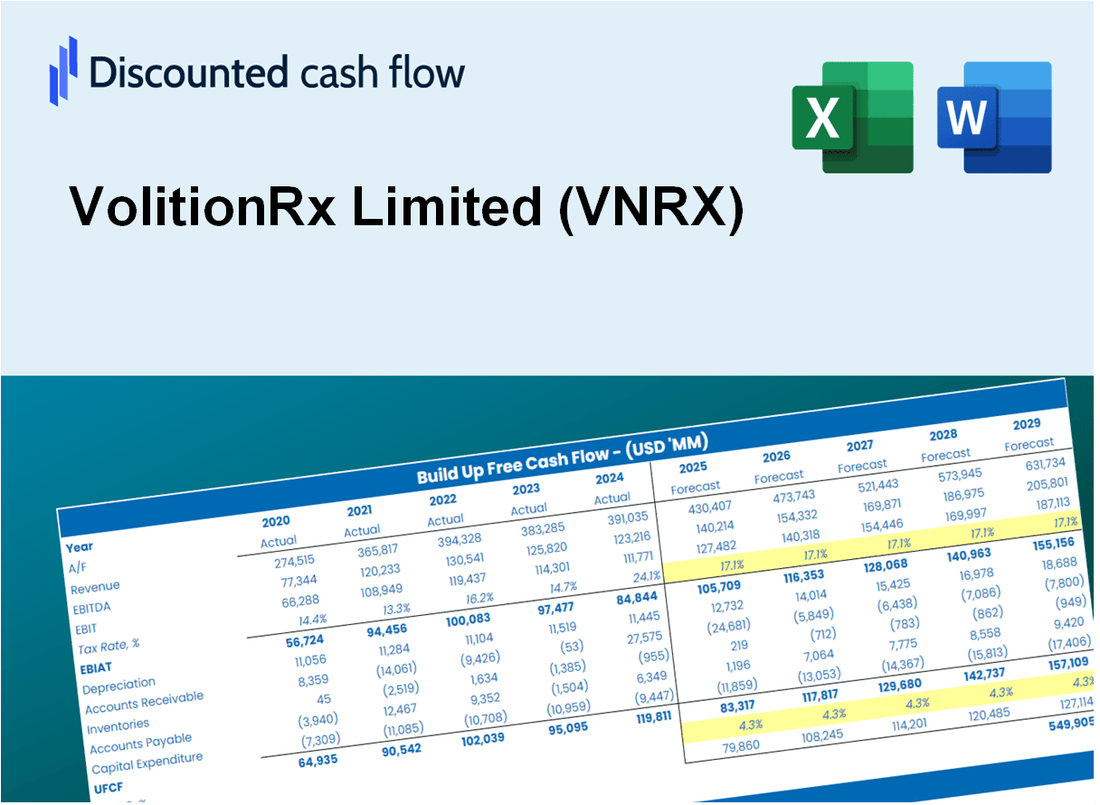
Discounted Cash Flow (DCF) - (USD MM)
| Year | AY1 2020 |
AY2 2021 |
AY3 2022 |
AY4 2023 |
AY5 2024 |
FY1 2025 |
FY2 2026 |
FY3 2027 |
FY4 2028 |
FY5 2029 |
|---|---|---|---|---|---|---|---|---|---|---|
| Revenue | .0 | .1 | .3 | .8 | 1.2 | 2.3 | 4.4 | 8.4 | 16.0 | 30.4 |
| Revenue Growth, % | 0 | 570.25 | 240.3 | 153.04 | 59.1 | 89.78 | 89.78 | 89.78 | 89.78 | 89.78 |
| EBITDA | -19.2 | -25.7 | -29.2 | -34.0 | -25.6 | -2.3 | -4.4 | -8.4 | -16.0 | -30.4 |
| EBITDA, % | -143140.94 | -28532.04 | -9541.84 | -4390.83 | -2073.65 | -100 | -100 | -100 | -100 | -100 |
| Depreciation | 1.0 | 1.1 | 1.2 | 1.4 | 1.3 | 2.3 | 4.4 | 8.4 | 16.0 | 30.4 |
| Depreciation, % | 7752.35 | 1271.91 | 388.37 | 182.29 | 108.55 | 100 | 100 | 100 | 100 | 100 |
| EBIT | -20.3 | -26.8 | -30.4 | -35.5 | -26.9 | -2.3 | -4.4 | -8.4 | -16.0 | -30.4 |
| EBIT, % | -150893.29 | -29803.94 | -9930.21 | -4573.11 | -2182.2 | -100 | -100 | -100 | -100 | -100 |
| Total Cash | 19.4 | 20.6 | 10.9 | 20.7 | 3.3 | 2.3 | 4.4 | 8.4 | 16.0 | 30.4 |
| Total Cash, percent | .1 | .0 | .0 | .0 | .0 | .0 | .0 | .0 | .0 | .0 |
| Account Receivables | .0 | .0 | .1 | .2 | .1 | .6 | 1.2 | 2.2 | 4.2 | 7.9 |
| Account Receivables, % | 52.99 | 13.89 | 23.7 | 31.29 | 8.96 | 26.17 | 26.17 | 26.17 | 26.17 | 26.17 |
| Inventories | .0 | .6 | .0 | .0 | .0 | .5 | .9 | 1.7 | 3.2 | 6.1 |
| Inventories, % | 0 | 664.59 | 0 | 0 | 0 | 20 | 20 | 20 | 20 | 20 |
| Accounts Payable | 1.5 | 1.5 | 3.0 | 3.2 | 2.8 | 2.3 | 4.4 | 8.4 | 16.0 | 30.4 |
| Accounts Payable, % | 11460.93 | 1713.17 | 993.17 | 414.2 | 224.25 | 100 | 100 | 100 | 100 | 100 |
| Capital Expenditure | -1.9 | -1.0 | -1.6 | -1.1 | -.6 | -2.1 | -4.0 | -7.5 | -14.3 | -27.1 |
| Capital Expenditure, % | -14449.94 | -1081.31 | -512.47 | -139.78 | -46.52 | -89.3 | -89.3 | -89.3 | -89.3 | -89.3 |
| Tax Rate, % | 1.06 | 1.06 | 1.06 | 1.06 | 1.06 | 1.06 | 1.06 | 1.06 | 1.06 | 1.06 |
| EBITAT | -20.2 | -26.7 | -30.1 | -35.1 | -26.6 | -2.3 | -4.4 | -8.4 | -15.9 | -30.1 |
| Depreciation | ||||||||||
| Changes in Account Receivables | ||||||||||
| Changes in Inventories | ||||||||||
| Changes in Accounts Payable | ||||||||||
| Capital Expenditure | ||||||||||
| UFCF | -19.6 | -27.1 | -28.4 | -34.8 | -26.2 | -3.5 | -2.8 | -5.3 | -10.1 | -19.1 |
| WACC, % | 8.96 | 8.96 | 8.95 | 8.95 | 8.95 | 8.96 | 8.96 | 8.96 | 8.96 | 8.96 |
| PV UFCF | ||||||||||
| SUM PV UFCF | -29.3 | |||||||||
| Long Term Growth Rate, % | 2.00 | |||||||||
| Free cash flow (T + 1) | -20 | |||||||||
| Terminal Value | -281 | |||||||||
| Present Terminal Value | -183 | |||||||||
| Enterprise Value | -212 | |||||||||
| Net Debt | 3 | |||||||||
| Equity Value | -215 | |||||||||
| Diluted Shares Outstanding, MM | 87 | |||||||||
| Equity Value Per Share | -2.48 |
What You Will Receive
- Authentic VNRX Financial Data: Pre-populated with VolitionRx Limited’s historical and forecasted data for accurate analysis.
- Completely Customizable Template: Easily adjust essential inputs such as revenue growth, WACC, and EBITDA %.
- Instant Calculations: Watch the intrinsic value of VNRX update in real-time as you make modifications.
- Expert Valuation Tool: Tailored for investors, analysts, and consultants aiming for precise DCF outcomes.
- Intuitive Design: User-friendly layout and straightforward guidelines suitable for all skill levels.
Key Features
- Customizable Financial Inputs: Adjust essential metrics such as revenue projections, gross margins, and R&D expenses.
- Instant DCF Valuation: Automatically computes intrinsic value, net present value, and additional financial metrics.
- High-Precision Analysis: Leverages VolitionRx's actual financial data for accurate valuation results.
- Streamlined Scenario Testing: Easily evaluate various assumptions and analyze different outcomes.
- Efficiency Booster: Avoid the complexity of constructing intricate valuation models from the ground up.
How It Works
- Download the Template: Get instant access to the Excel-based VNRX DCF Calculator.
- Input Your Assumptions: Adjust the yellow-highlighted cells for growth rates, WACC, margins, and other variables.
- Instant Calculations: The model automatically updates VolitionRx's intrinsic value.
- Test Scenarios: Simulate various assumptions to assess potential changes in valuation.
- Analyze and Decide: Utilize the results to inform your investment or financial analysis.
Why Choose This Calculator for VolitionRx Limited (VNRX)?
- All-in-One Solution: Offers DCF, WACC, and financial ratio analyses tailored for VolitionRx Limited (VNRX).
- Flexible Parameters: Modify the highlighted cells to explore different financial scenarios.
- In-Depth Analysis: Automatically computes VolitionRx Limited’s (VNRX) intrinsic value and Net Present Value.
- Preloaded Information: Historical and projected data provide reliable foundations for analysis.
- Expert-Level Tool: Perfect for financial analysts, investors, and consultants focused on VolitionRx Limited (VNRX).
Who Should Use VolitionRx Limited (VNRX)?
- Investors: Gain insights and make informed decisions with advanced diagnostic tools.
- Healthcare Professionals: Utilize innovative technology to improve patient outcomes and diagnostics.
- Researchers: Adapt our solutions for clinical studies and data analysis.
- Biotech Enthusiasts: Explore the latest advancements in cancer detection and diagnostics.
- Educators and Students: Leverage real-world applications of biotechnology in academic settings.
What the Template Contains
- Historical Data: Includes VolitionRx Limited's (VNRX) past financials and baseline forecasts.
- DCF and Levered DCF Models: Detailed templates to calculate VolitionRx Limited's (VNRX) intrinsic value.
- WACC Sheet: Pre-built calculations for Weighted Average Cost of Capital.
- Editable Inputs: Modify key drivers like growth rates, EBITDA %, and CAPEX assumptions.
- Quarterly and Annual Statements: A complete breakdown of VolitionRx Limited's (VNRX) financials.
- Interactive Dashboard: Visualize valuation results and projections dynamically.
Disclaimer
All information, articles, and product details provided on this website are for general informational and educational purposes only. We do not claim any ownership over, nor do we intend to infringe upon, any trademarks, copyrights, logos, brand names, or other intellectual property mentioned or depicted on this site. Such intellectual property remains the property of its respective owners, and any references here are made solely for identification or informational purposes, without implying any affiliation, endorsement, or partnership.
We make no representations or warranties, express or implied, regarding the accuracy, completeness, or suitability of any content or products presented. Nothing on this website should be construed as legal, tax, investment, financial, medical, or other professional advice. In addition, no part of this site—including articles or product references—constitutes a solicitation, recommendation, endorsement, advertisement, or offer to buy or sell any securities, franchises, or other financial instruments, particularly in jurisdictions where such activity would be unlawful.
All content is of a general nature and may not address the specific circumstances of any individual or entity. It is not a substitute for professional advice or services. Any actions you take based on the information provided here are strictly at your own risk. You accept full responsibility for any decisions or outcomes arising from your use of this website and agree to release us from any liability in connection with your use of, or reliance upon, the content or products found herein.