
|
Vyne Therapeutics Inc. (Vyne) DCF تقييم |
Fully Editable: Tailor To Your Needs In Excel Or Sheets
Professional Design: Trusted, Industry-Standard Templates
Investor-Approved Valuation Models
MAC/PC Compatible, Fully Unlocked
No Expertise Is Needed; Easy To Follow
VYNE Therapeutics Inc. (VYNE) Bundle
تبسيط تقييم Vyne Therapeutics Inc. (Vyne) مع هذه الآلة الحاسبة DCF القابلة للتخصيص! يتميز Vyne Financials ومدخلات التنبؤ القابلة للتعديل ، يمكنك اختبار السيناريوهات والكشف عن القيمة العادلة لـ Vyne في دقائق.
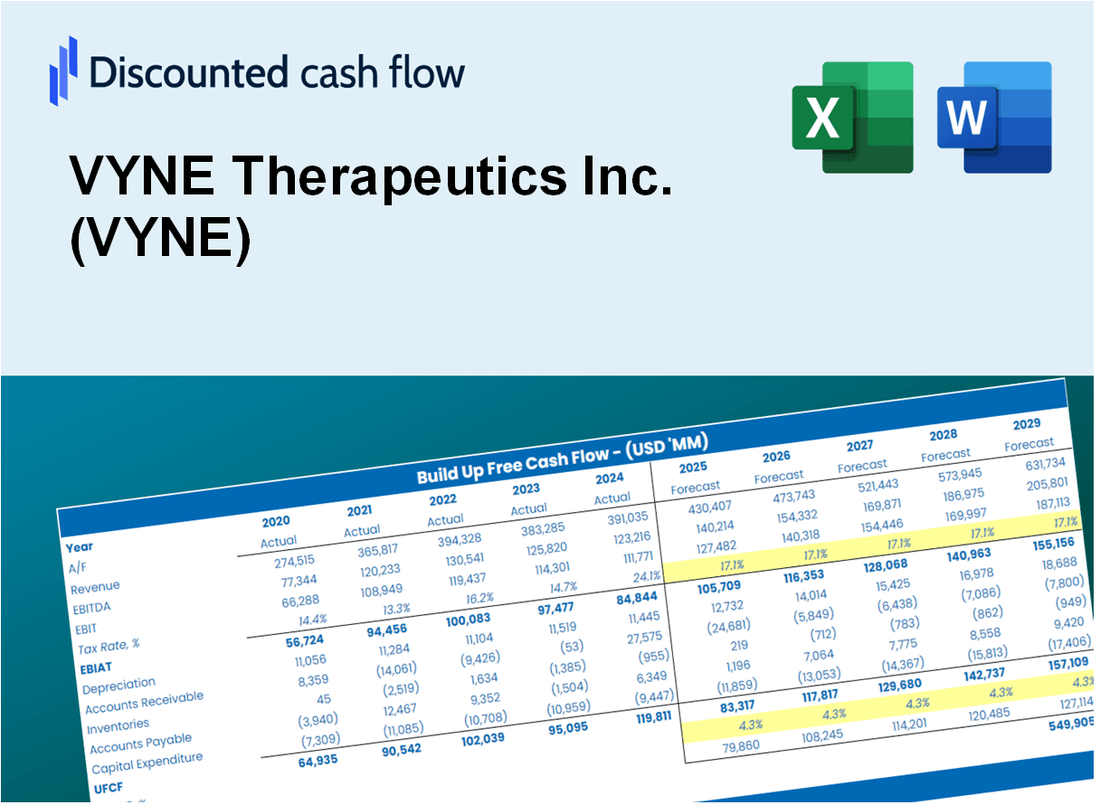
Discounted Cash Flow (DCF) - (USD MM)
| Year | AY1 2020 |
AY2 2021 |
AY3 2022 |
AY4 2023 |
AY5 2024 |
FY1 2025 |
FY2 2026 |
FY3 2027 |
FY4 2028 |
FY5 2029 |
|---|---|---|---|---|---|---|---|---|---|---|
| Revenue | 21.0 | .9 | .5 | .4 | .5 | .3 | .2 | .1 | .1 | .1 |
| Revenue Growth, % | 0 | -95.57 | -48.76 | -11.11 | 18.16 | -34.32 | -34.32 | -34.32 | -34.32 | -34.32 |
| EBITDA | -251.1 | -38.8 | -34.2 | -29.3 | -43.6 | -.3 | -.2 | -.1 | -.1 | -.1 |
| EBITDA, % | -1196.09 | -4167.78 | -7174.63 | -6900.47 | -8709.18 | -100 | -100 | -100 | -100 | -100 |
| Depreciation | .3 | .1 | .1 | .0 | .0 | .0 | .0 | .0 | .0 | .0 |
| Depreciation, % | 1.62 | 11.71 | 15.09 | 0 | 0.7984 | 5.84 | 5.84 | 5.84 | 5.84 | 5.84 |
| EBIT | -251.4 | -38.9 | -34.3 | -29.3 | -43.6 | -.3 | -.2 | -.1 | -.1 | -.1 |
| EBIT, % | -1197.71 | -4179.48 | -7189.73 | -6900.47 | -8709.98 | -100 | -100 | -100 | -100 | -100 |
| Total Cash | 58.6 | 42.3 | 30.9 | 93.3 | 61.5 | .3 | .2 | .1 | .1 | .1 |
| Total Cash, percent | .0 | .0 | .0 | .0 | .0 | .0 | .0 | .0 | .0 | .0 |
| Account Receivables | 15.8 | 7.6 | 5.0 | .0 | .0 | .2 | .1 | .1 | .1 | .0 |
| Account Receivables, % | 75.35 | 814.5 | 1048.22 | 0 | 0 | 55.07 | 55.07 | 55.07 | 55.07 | 55.07 |
| Inventories | 7.4 | 7.3 | .0 | .0 | .0 | .1 | .1 | .0 | .0 | .0 |
| Inventories, % | 35.27 | 783.14 | 0 | 0 | 0 | 27.05 | 27.05 | 27.05 | 27.05 | 27.05 |
| Accounts Payable | 4.8 | 6.5 | 2.4 | 1.7 | 2.7 | .3 | .2 | .1 | .1 | .1 |
| Accounts Payable, % | 22.77 | 699.25 | 500.21 | 391.27 | 540.32 | 84.55 | 84.55 | 84.55 | 84.55 | 84.55 |
| Capital Expenditure | -.1 | .0 | .0 | .0 | -.1 | .0 | .0 | .0 | .0 | .0 |
| Capital Expenditure, % | -0.53827 | 0 | 0 | 0 | -23.35 | -4.78 | -4.78 | -4.78 | -4.78 | -4.78 |
| Tax Rate, % | -0.07788358 | -0.07788358 | -0.07788358 | -0.07788358 | -0.07788358 | -0.07788358 | -0.07788358 | -0.07788358 | -0.07788358 | -0.07788358 |
| EBITAT | -251.2 | -65.2 | -23.5 | -29.9 | -43.7 | -.3 | -.2 | -.1 | -.1 | -.1 |
| Depreciation | ||||||||||
| Changes in Account Receivables | ||||||||||
| Changes in Inventories | ||||||||||
| Changes in Accounts Payable | ||||||||||
| Capital Expenditure | ||||||||||
| UFCF | -269.4 | -55.0 | -17.6 | -25.6 | -42.7 | -3.0 | -.2 | -.1 | -.1 | -.1 |
| WACC, % | 13.18 | 13.18 | 13.18 | 13.18 | 13.18 | 13.18 | 13.18 | 13.18 | 13.18 | 13.18 |
| PV UFCF | ||||||||||
| SUM PV UFCF | -3.0 | |||||||||
| Long Term Growth Rate, % | 2.00 | |||||||||
| Free cash flow (T + 1) | 0 | |||||||||
| Terminal Value | -1 | |||||||||
| Present Terminal Value | 0 | |||||||||
| Enterprise Value | -3 | |||||||||
| Net Debt | -20 | |||||||||
| Equity Value | 17 | |||||||||
| Diluted Shares Outstanding, MM | 43 | |||||||||
| Equity Value Per Share | 0.39 |
What You Will Receive
- Customizable Excel Template: A fully adjustable Excel-based DCF Calculator featuring pre-filled financial data for VYNE Therapeutics Inc. (VYNE).
- Actual Market Data: Access to historical performance and future projections (highlighted in the yellow cells).
- Adjustable Forecasts: Modify key assumptions such as revenue growth, EBITDA %, and WACC.
- Instant Calculations: Quickly observe how your inputs affect VYNE’s valuation.
- Professional Resource: Designed for investors, CFOs, consultants, and financial analysts.
- Intuitive Layout: Organized for simplicity and ease of navigation, complete with step-by-step guidance.
Key Features
- Comprehensive DCF Calculator: Features detailed unlevered and levered DCF valuation models tailored for VYNE Therapeutics Inc. (VYNE).
- WACC Calculator: Pre-configured Weighted Average Cost of Capital sheet with adjustable inputs specific to VYNE.
- Customizable Forecast Assumptions: Adjust growth rates, capital expenditures, and discount rates to fit VYNE's financial landscape.
- Integrated Financial Ratios: Evaluate profitability, leverage, and efficiency ratios relevant to VYNE Therapeutics Inc. (VYNE).
- Interactive Dashboard and Charts: Visual representations provide a summary of key valuation metrics for straightforward analysis.
How It Works
- Step 1: Download the Excel file for VYNE Therapeutics Inc. (VYNE).
- Step 2: Review VYNE's pre-filled financial data and forecasts.
- Step 3: Modify key inputs such as revenue growth, WACC, and tax rates (highlighted cells).
- Step 4: Observe the DCF model update in real-time as you adjust your assumptions.
- Step 5: Analyze the results and leverage them for informed investment decisions.
Why Choose VYNE Therapeutics Inc. (VYNE)?
- Innovative Solutions: Cutting-edge therapies designed to address unmet medical needs.
- Proven Expertise: A team of experienced professionals dedicated to advancing healthcare.
- Commitment to Quality: Rigorous research and development processes ensure high standards.
- Patient-Centric Approach: Focused on improving patient outcomes through targeted treatments.
- Strong Partnerships: Collaborations with leading institutions to enhance research capabilities.
Who Should Use VYNE Therapeutics Inc. (VYNE)?
- Investors: Gain insights into innovative therapies and make informed investment choices.
- Healthcare Analysts: Utilize comprehensive data to evaluate the company's pipeline and market potential.
- Consultants: Tailor reports and presentations to highlight VYNE's strategic initiatives and growth opportunities.
- Pharmaceutical Enthusiasts: Expand your knowledge of drug development processes and industry trends.
- Educators and Students: Leverage real-life case studies of VYNE for discussions in healthcare and business courses.
What the VYNE Template Contains
- Comprehensive DCF Model: Editable template featuring detailed valuation calculations tailored for VYNE Therapeutics Inc. (VYNE).
- Real-World Data: VYNE’s historical and projected financials preloaded for in-depth analysis.
- Customizable Parameters: Adjust WACC, growth rates, and tax assumptions to explore various scenarios.
- Financial Statements: Complete annual and quarterly breakdowns for enhanced insights into VYNE's performance.
- Key Ratios: Integrated analysis for profitability, efficiency, and leverage specific to VYNE.
- Dashboard with Visual Outputs: Charts and tables designed for clear, actionable results regarding VYNE Therapeutics Inc. (VYNE).
Disclaimer
All information, articles, and product details provided on this website are for general informational and educational purposes only. We do not claim any ownership over, nor do we intend to infringe upon, any trademarks, copyrights, logos, brand names, or other intellectual property mentioned or depicted on this site. Such intellectual property remains the property of its respective owners, and any references here are made solely for identification or informational purposes, without implying any affiliation, endorsement, or partnership.
We make no representations or warranties, express or implied, regarding the accuracy, completeness, or suitability of any content or products presented. Nothing on this website should be construed as legal, tax, investment, financial, medical, or other professional advice. In addition, no part of this site—including articles or product references—constitutes a solicitation, recommendation, endorsement, advertisement, or offer to buy or sell any securities, franchises, or other financial instruments, particularly in jurisdictions where such activity would be unlawful.
All content is of a general nature and may not address the specific circumstances of any individual or entity. It is not a substitute for professional advice or services. Any actions you take based on the information provided here are strictly at your own risk. You accept full responsibility for any decisions or outcomes arising from your use of this website and agree to release us from any liability in connection with your use of, or reliance upon, the content or products found herein.