
|
Wayfair Inc. (W) تقييم DCF |
Fully Editable: Tailor To Your Needs In Excel Or Sheets
Professional Design: Trusted, Industry-Standard Templates
Investor-Approved Valuation Models
MAC/PC Compatible, Fully Unlocked
No Expertise Is Needed; Easy To Follow
Wayfair Inc. (W) Bundle
تبسيط العملية الخاصة بك وتحسين الدقة من خلال حاسبة (W) DCF! باستخدام بيانات حقيقية من Wayfair Inc. والافتراضات القابلة للتخصيص ، تمكنك هذه الأداة من التنبؤ وتحليل وتقييم Wayfair مثل المستثمر المحنك.
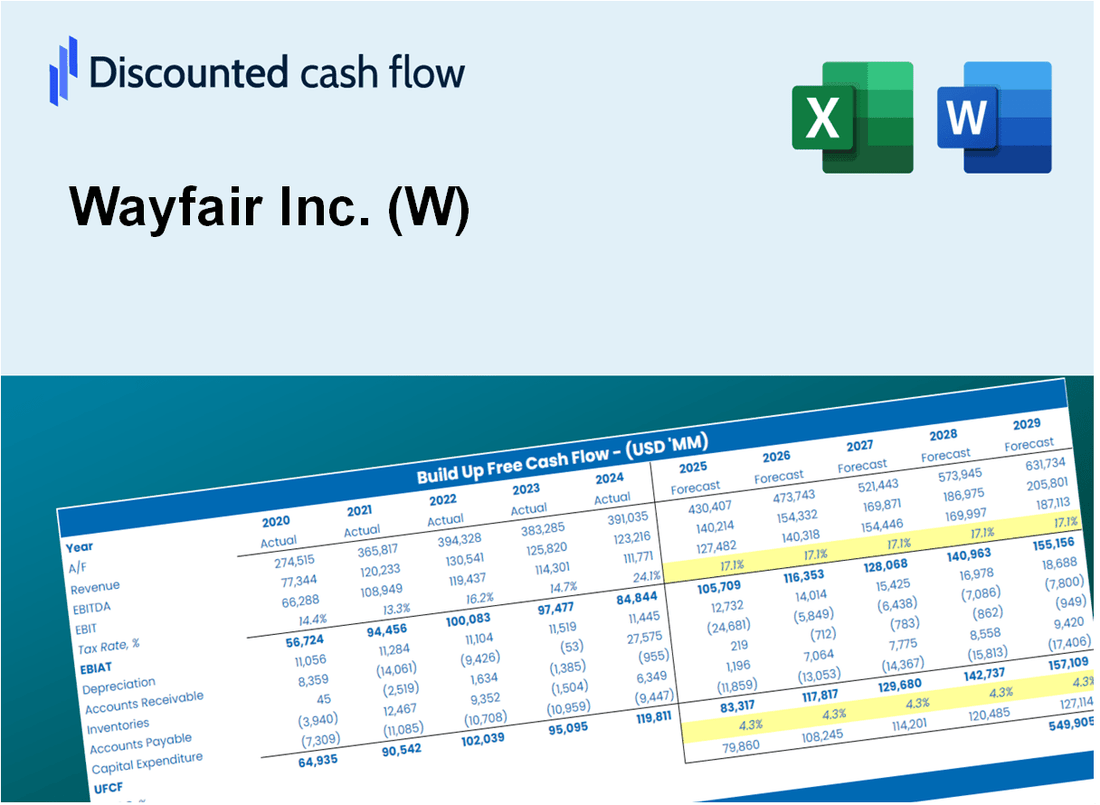
Discounted Cash Flow (DCF) - (USD MM)
| Year | AY1 2020 |
AY2 2021 |
AY3 2022 |
AY4 2023 |
AY5 2024 |
FY1 2025 |
FY2 2026 |
FY3 2027 |
FY4 2028 |
FY5 2029 |
|---|---|---|---|---|---|---|---|---|---|---|
| Revenue | 14,145.2 | 13,708.0 | 12,218.0 | 12,003.0 | 11,851.0 | 11,347.7 | 10,865.9 | 10,404.4 | 9,962.6 | 9,539.5 |
| Revenue Growth, % | 0 | -3.09 | -10.87 | -1.76 | -1.27 | -4.25 | -4.25 | -4.25 | -4.25 | -4.25 |
| EBITDA | 637.4 | 224.0 | -921.0 | -295.0 | -66.0 | -100.1 | -95.9 | -91.8 | -87.9 | -84.2 |
| EBITDA, % | 4.51 | 1.63 | -7.54 | -2.46 | -0.55692 | -0.88246 | -0.88246 | -0.88246 | -0.88246 | -0.88246 |
| Depreciation | 285.7 | 322.0 | 371.0 | 417.0 | 387.0 | 321.0 | 307.4 | 294.3 | 281.8 | 269.9 |
| Depreciation, % | 2.02 | 2.35 | 3.04 | 3.47 | 3.27 | 2.83 | 2.83 | 2.83 | 2.83 | 2.83 |
| EBIT | 351.7 | -98.0 | -1,292.0 | -712.0 | -453.0 | -421.2 | -403.3 | -386.2 | -369.8 | -354.1 |
| EBIT, % | 2.49 | -0.71491 | -10.57 | -5.93 | -3.82 | -3.71 | -3.71 | -3.71 | -3.71 | -3.71 |
| Total Cash | 2,592.0 | 2,399.0 | 1,278.0 | 1,351.0 | 1,372.0 | 1,568.7 | 1,502.0 | 1,438.3 | 1,377.2 | 1,318.7 |
| Total Cash, percent | .0 | .0 | .0 | .0 | .0 | .0 | .0 | .0 | .0 | .0 |
| Account Receivables | 172.0 | 296.0 | 341.0 | 234.0 | 290.0 | 239.7 | 229.5 | 219.8 | 210.5 | 201.5 |
| Account Receivables, % | 1.22 | 2.16 | 2.79 | 1.95 | 2.45 | 2.11 | 2.11 | 2.11 | 2.11 | 2.11 |
| Inventories | 52.0 | 69.0 | 90.0 | 75.0 | 76.0 | 65.2 | 62.5 | 59.8 | 57.3 | 54.8 |
| Inventories, % | 0.36762 | 0.50336 | 0.73662 | 0.62484 | 0.6413 | 0.57475 | 0.57475 | 0.57475 | 0.57475 | 0.57475 |
| Accounts Payable | 1,157.0 | 1,166.0 | 1,204.0 | 1,234.0 | 1,246.0 | 1,074.3 | 1,028.7 | 985.0 | 943.1 | 903.1 |
| Accounts Payable, % | 8.18 | 8.51 | 9.85 | 10.28 | 10.51 | 9.47 | 9.47 | 9.47 | 9.47 | 9.47 |
| Capital Expenditure | -334.4 | -280.0 | -458.0 | -351.0 | -234.0 | -296.3 | -283.7 | -271.6 | -260.1 | -249.1 |
| Capital Expenditure, % | -2.36 | -2.04 | -3.75 | -2.92 | -1.97 | -2.61 | -2.61 | -2.61 | -2.61 | -2.61 |
| Tax Rate, % | -2.07 | -2.07 | -2.07 | -2.07 | -2.07 | -2.07 | -2.07 | -2.07 | -2.07 | -2.07 |
| EBITAT | 316.9 | -98.8 | -1,303.8 | -720.8 | -462.4 | -412.8 | -395.3 | -378.5 | -362.4 | -347.0 |
| Depreciation | ||||||||||
| Changes in Account Receivables | ||||||||||
| Changes in Inventories | ||||||||||
| Changes in Accounts Payable | ||||||||||
| Capital Expenditure | ||||||||||
| UFCF | 1,201.2 | -188.8 | -1,418.8 | -502.8 | -354.4 | -498.7 | -404.3 | -387.1 | -370.7 | -354.9 |
| WACC, % | 14.39 | 14.48 | 14.48 | 14.48 | 14.48 | 14.46 | 14.46 | 14.46 | 14.46 | 14.46 |
| PV UFCF | ||||||||||
| SUM PV UFCF | -1,399.0 | |||||||||
| Long Term Growth Rate, % | 4.00 | |||||||||
| Free cash flow (T + 1) | -369 | |||||||||
| Terminal Value | -3,529 | |||||||||
| Present Terminal Value | -1,796 | |||||||||
| Enterprise Value | -3,195 | |||||||||
| Net Debt | 2,905 | |||||||||
| Equity Value | -6,100 | |||||||||
| Diluted Shares Outstanding, MM | 123 | |||||||||
| Equity Value Per Share | -49.59 |
What You Will Get
- Comprehensive W Financials: Access to both historical and projected data for precise valuation.
- Customizable Inputs: Adjust WACC, tax rates, revenue growth, and capital expenditures as needed.
- Dynamic Calculations: Intrinsic value and NPV are computed in real-time.
- Scenario Analysis: Explore various scenarios to assess Wayfair’s future performance.
- User-Friendly Design: Crafted for experts while remaining approachable for newcomers.
Key Features
- Comprehensive Wayfair Financials: Access precise pre-loaded historical data and future estimates for Wayfair Inc. (W).
- Adjustable Forecast Parameters: Modify highlighted cells for key metrics like WACC, growth rates, and profit margins.
- Real-Time Calculations: Automatic updates to DCF, Net Present Value (NPV), and cash flow assessments.
- Interactive Dashboard: User-friendly charts and summaries to help visualize your valuation insights.
- Designed for All Skill Levels: An intuitive framework suitable for investors, CFOs, and consultants alike.
How It Works
- Step 1: Download the prebuilt Excel template featuring Wayfair Inc.’s (W) data.
- Step 2: Navigate through the pre-filled sheets to familiarize yourself with the key metrics.
- Step 3: Modify forecasts and assumptions in the editable yellow cells (WACC, growth, margins).
- Step 4: Instantly see the recalculated results, including Wayfair Inc.’s (W) intrinsic value.
- Step 5: Utilize the outputs to make informed investment decisions or create reports.
Why Choose This Calculator for Wayfair Inc. (W)?
- Comprehensive Tool: Combines DCF, WACC, and financial ratio analyses tailored for Wayfair Inc. (W).
- Customizable Inputs: Modify yellow-highlighted cells to explore different scenarios relevant to Wayfair Inc. (W).
- Detailed Insights: Automatically calculates Wayfair’s intrinsic value and Net Present Value for informed decision-making.
- Preloaded Data: Historical and forecasted data specific to Wayfair Inc. (W) provide accurate starting points.
- Professional Quality: Perfect for financial analysts, investors, and business consultants focusing on Wayfair Inc. (W).
Who Should Use This Product?
- eCommerce Students: Understand market strategies and apply them using real data from Wayfair Inc. (W).
- Researchers: Integrate industry models into studies or academic projects related to online retail.
- Investors: Evaluate your own projections and assess valuation scenarios for Wayfair Inc. (W) stock.
- Market Analysts: Enhance your analysis with a tailored, ready-to-use financial model for eCommerce.
- Entrepreneurs: Learn from the operational strategies of established online retailers like Wayfair Inc. (W).
What the Template Contains
- Pre-Filled Data: Includes Wayfair Inc.'s (W) historical financials and forecasts.
- Discounted Cash Flow Model: Editable DCF valuation model with automatic calculations.
- Weighted Average Cost of Capital (WACC): A dedicated sheet for calculating WACC based on custom inputs.
- Key Financial Ratios: Analyze Wayfair Inc.'s (W) profitability, efficiency, and leverage.
- Customizable Inputs: Edit revenue growth, margins, and tax rates with ease.
- Clear Dashboard: Charts and tables summarizing key valuation results.
Disclaimer
All information, articles, and product details provided on this website are for general informational and educational purposes only. We do not claim any ownership over, nor do we intend to infringe upon, any trademarks, copyrights, logos, brand names, or other intellectual property mentioned or depicted on this site. Such intellectual property remains the property of its respective owners, and any references here are made solely for identification or informational purposes, without implying any affiliation, endorsement, or partnership.
We make no representations or warranties, express or implied, regarding the accuracy, completeness, or suitability of any content or products presented. Nothing on this website should be construed as legal, tax, investment, financial, medical, or other professional advice. In addition, no part of this site—including articles or product references—constitutes a solicitation, recommendation, endorsement, advertisement, or offer to buy or sell any securities, franchises, or other financial instruments, particularly in jurisdictions where such activity would be unlawful.
All content is of a general nature and may not address the specific circumstances of any individual or entity. It is not a substitute for professional advice or services. Any actions you take based on the information provided here are strictly at your own risk. You accept full responsibility for any decisions or outcomes arising from your use of this website and agree to release us from any liability in connection with your use of, or reliance upon, the content or products found herein.