
|
Western Digital Corporation (WDC) DCF تقييم |
Fully Editable: Tailor To Your Needs In Excel Or Sheets
Professional Design: Trusted, Industry-Standard Templates
Investor-Approved Valuation Models
MAC/PC Compatible, Fully Unlocked
No Expertise Is Needed; Easy To Follow
Western Digital Corporation (WDC) Bundle
عزز استراتيجيات الاستثمار الخاصة بك مع حاسبة (WDC) DCF! الاستفادة من البيانات المالية الرقمية الغربية الأصلية ، وضبط توقعات النمو والنفقات ، ومراقبة على الفور كيف تؤثر هذه التعديلات على القيمة الجوهرية لـ (WDC).
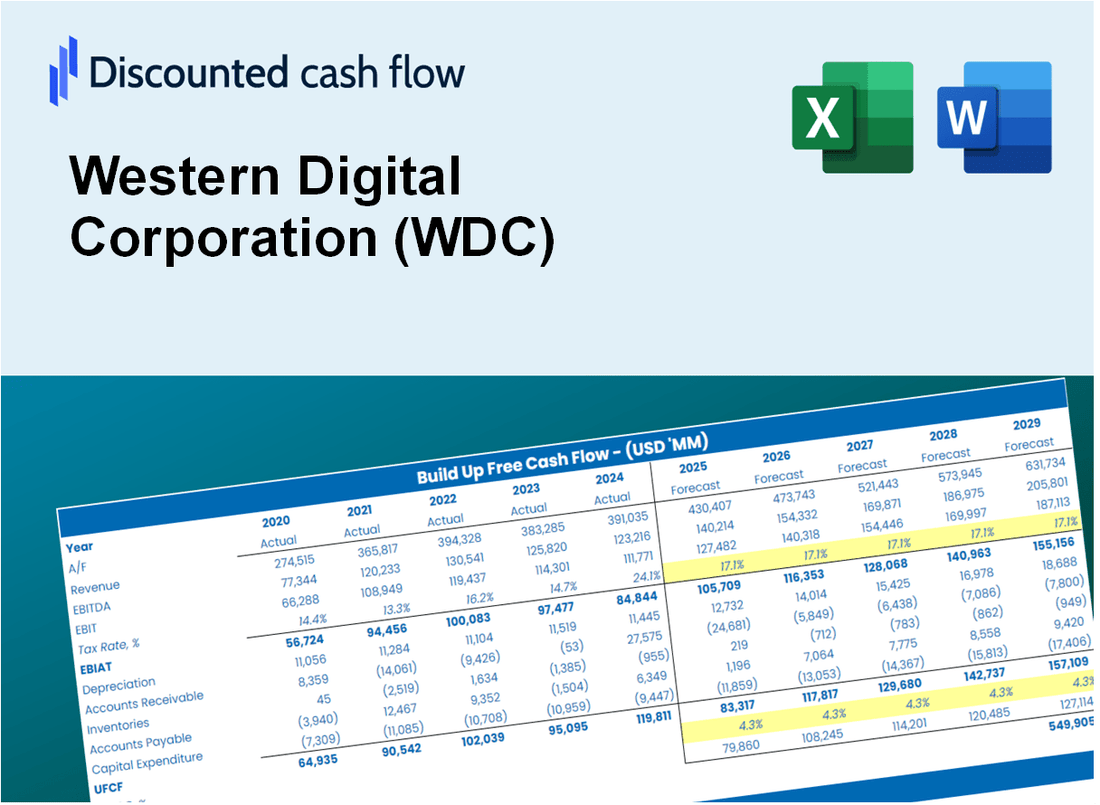
Discounted Cash Flow (DCF) - (USD MM)
| Year | AY1 2021 |
AY2 2022 |
AY3 2023 |
AY4 2024 |
AY5 2025 |
FY1 2026 |
FY2 2027 |
FY3 2028 |
FY4 2029 |
FY5 2030 |
|---|---|---|---|---|---|---|---|---|---|---|
| Revenue | 16,922.0 | 18,793.0 | 6,255.0 | 6,317.0 | 9,520.0 | 9,425.7 | 9,332.2 | 9,239.8 | 9,148.2 | 9,057.5 |
| Revenue Growth, % | 0 | 11.06 | -66.72 | 0.99121 | 50.7 | -0.99102 | -0.99102 | -0.99102 | -0.99102 | -0.99102 |
| EBITDA | 2,465.0 | 3,404.0 | 289.0 | 243.0 | 1,938.0 | 1,159.4 | 1,147.9 | 1,136.6 | 1,125.3 | 1,114.2 |
| EBITDA, % | 14.57 | 18.11 | 4.62 | 3.85 | 20.36 | 12.3 | 12.3 | 12.3 | 12.3 | 12.3 |
| Depreciation | 1,212.0 | 929.0 | 828.0 | 568.0 | 451.0 | 736.6 | 729.3 | 722.0 | 714.9 | 707.8 |
| Depreciation, % | 7.16 | 4.94 | 13.24 | 8.99 | 4.74 | 7.81 | 7.81 | 7.81 | 7.81 | 7.81 |
| EBIT | 1,253.0 | 2,475.0 | -539.0 | -325.0 | 1,487.0 | 422.9 | 418.7 | 414.5 | 410.4 | 406.4 |
| EBIT, % | 7.4 | 13.17 | -8.62 | -5.14 | 15.62 | 4.49 | 4.49 | 4.49 | 4.49 | 4.49 |
| Total Cash | 3,370.0 | 2,327.0 | 2,023.0 | 1,551.0 | 2,468.0 | 2,170.1 | 2,148.6 | 2,127.3 | 2,106.2 | 2,085.3 |
| Total Cash, percent | .0 | .0 | .0 | .0 | .0 | .0 | .0 | .0 | .0 | .0 |
| Account Receivables | 2,257.0 | 2,804.0 | 1,598.0 | 1,231.0 | 1,486.0 | 1,675.9 | 1,659.3 | 1,642.9 | 1,626.6 | 1,610.5 |
| Account Receivables, % | 13.34 | 14.92 | 25.55 | 19.49 | 15.61 | 17.78 | 17.78 | 17.78 | 17.78 | 17.78 |
| Inventories | 3,616.0 | 3,638.0 | 3,698.0 | 1,387.0 | 1,291.0 | 2,551.8 | 2,526.5 | 2,501.5 | 2,476.7 | 2,452.1 |
| Inventories, % | 21.37 | 19.36 | 59.12 | 21.96 | 13.56 | 27.07 | 27.07 | 27.07 | 27.07 | 27.07 |
| Accounts Payable | 2,332.0 | 2,222.0 | 1,585.0 | 1,054.0 | 1,266.0 | 1,525.6 | 1,510.5 | 1,495.5 | 1,480.7 | 1,466.0 |
| Accounts Payable, % | 13.78 | 11.82 | 25.34 | 16.69 | 13.3 | 16.19 | 16.19 | 16.19 | 16.19 | 16.19 |
| Capital Expenditure | -1,003.0 | -1,107.0 | -807.0 | -487.0 | -407.0 | -691.9 | -685.1 | -678.3 | -671.5 | -664.9 |
| Capital Expenditure, % | -5.93 | -5.89 | -12.9 | -7.71 | -4.28 | -7.34 | -7.34 | -7.34 | -7.34 | -7.34 |
| Tax Rate, % | -64.69 | -64.69 | -64.69 | -64.69 | -64.69 | -64.69 | -64.69 | -64.69 | -64.69 | -64.69 |
| EBITAT | 1,109.7 | 1,762.5 | -1,069.1 | -350.9 | 2,448.9 | 388.9 | 385.0 | 381.2 | 377.4 | 373.7 |
| Depreciation | ||||||||||
| Changes in Account Receivables | ||||||||||
| Changes in Inventories | ||||||||||
| Changes in Accounts Payable | ||||||||||
| Capital Expenditure | ||||||||||
| UFCF | -2,222.3 | 905.5 | -539.1 | 1,877.1 | 2,545.9 | -757.6 | 456.0 | 451.5 | 447.0 | 442.6 |
| WACC, % | 12.14 | 12.04 | 12.21 | 12.21 | 12.21 | 12.16 | 12.16 | 12.16 | 12.16 | 12.16 |
| PV UFCF | ||||||||||
| SUM PV UFCF | 538.6 | |||||||||
| Long Term Growth Rate, % | 3.90 | |||||||||
| Free cash flow (T + 1) | 460 | |||||||||
| Terminal Value | 5,564 | |||||||||
| Present Terminal Value | 3,134 | |||||||||
| Enterprise Value | 3,673 | |||||||||
| Net Debt | 2,967 | |||||||||
| Equity Value | 706 | |||||||||
| Diluted Shares Outstanding, MM | 359 | |||||||||
| Equity Value Per Share | 1.97 |
What You Will Receive
- Pre-Filled Financial Model: Utilizing Western Digital's (WDC) actual data for accurate DCF valuation.
- Comprehensive Forecast Control: Modify revenue growth, profit margins, WACC, and other essential factors.
- Real-Time Calculations: Automatic updates provide immediate feedback as you adjust inputs.
- Professional-Grade Template: A polished Excel file crafted for high-quality valuation analysis.
- Flexible and Reusable: Designed for adaptability, allowing for repeated application in detailed forecasting.
Key Features
- Comprehensive Financial Data: Gain insights with reliable pre-loaded historical figures and future estimates for Western Digital Corporation (WDC).
- Adjustable Forecast Variables: Modify highlighted cells for key metrics such as WACC, growth rates, and profit margins.
- Real-Time Calculations: Automatic adjustments to DCF, Net Present Value (NPV), and cash flow assessments.
- Interactive Dashboard: User-friendly charts and summaries to help visualize your valuation findings.
- Designed for All Skill Levels: An intuitive layout suitable for investors, CFOs, and consultants alike.
How It Works
- Step 1: Download the Excel file.
- Step 2: Review pre-entered Western Digital Corporation (WDC) data (historical and projected).
- Step 3: Adjust key assumptions (yellow cells) based on your analysis.
- Step 4: View automatic recalculations for Western Digital Corporation's (WDC) intrinsic value.
- Step 5: Use the outputs for investment decisions or reporting.
Why Choose This Calculator for Western Digital Corporation (WDC)?
- Accurate Data: Up-to-date Western Digital financials provide trustworthy valuation outcomes.
- Customizable: Tailor essential parameters such as growth rates, WACC, and tax rates to fit your forecasts.
- Time-Saving: Pre-configured calculations reduce the need to build from the ground up.
- Professional-Grade Tool: Crafted for investors, analysts, and financial consultants.
- User-Friendly: Easy-to-navigate design and clear instructions make it accessible for all users.
Who Should Use This Product?
- Data Storage Students: Explore data management techniques and apply them to real-world scenarios.
- Researchers: Integrate industry-standard models into academic projects or studies.
- Investors: Evaluate your investment strategies and assess valuation metrics for Western Digital Corporation (WDC).
- Market Analysts: Enhance your analysis with a customizable financial model tailored for the data storage sector.
- Tech Entrepreneurs: Understand how major players like Western Digital Corporation (WDC) are evaluated in the market.
What the Template Contains
- Pre-Filled DCF Model: Western Digital Corporation’s (WDC) financial data preloaded for immediate use.
- WACC Calculator: Detailed calculations for Weighted Average Cost of Capital.
- Financial Ratios: Evaluate Western Digital Corporation’s (WDC) profitability, leverage, and efficiency.
- Editable Inputs: Change assumptions such as growth, margins, and CAPEX to fit your scenarios.
- Financial Statements: Annual and quarterly reports to support detailed analysis.
- Interactive Dashboard: Easily visualize key valuation metrics and results.
Disclaimer
All information, articles, and product details provided on this website are for general informational and educational purposes only. We do not claim any ownership over, nor do we intend to infringe upon, any trademarks, copyrights, logos, brand names, or other intellectual property mentioned or depicted on this site. Such intellectual property remains the property of its respective owners, and any references here are made solely for identification or informational purposes, without implying any affiliation, endorsement, or partnership.
We make no representations or warranties, express or implied, regarding the accuracy, completeness, or suitability of any content or products presented. Nothing on this website should be construed as legal, tax, investment, financial, medical, or other professional advice. In addition, no part of this site—including articles or product references—constitutes a solicitation, recommendation, endorsement, advertisement, or offer to buy or sell any securities, franchises, or other financial instruments, particularly in jurisdictions where such activity would be unlawful.
All content is of a general nature and may not address the specific circumstances of any individual or entity. It is not a substitute for professional advice or services. Any actions you take based on the information provided here are strictly at your own risk. You accept full responsibility for any decisions or outcomes arising from your use of this website and agree to release us from any liability in connection with your use of, or reliance upon, the content or products found herein.