
|
WEX Inc. (WEX) تقييم DCF |
Fully Editable: Tailor To Your Needs In Excel Or Sheets
Professional Design: Trusted, Industry-Standard Templates
Investor-Approved Valuation Models
MAC/PC Compatible, Fully Unlocked
No Expertise Is Needed; Easy To Follow
WEX Inc. (WEX) Bundle
عزز استراتيجيات الاستثمار الخاصة بك مع حاسبة WEX Inc. (WEX) DCF! الاستفادة من البيانات المالية للموارد البشرية الفعلية ، وضبط تنبؤات النمو والنفقات ، ومراقبة على الفور كيف تؤثر هذه التغييرات على القيمة الجوهرية لشركة WEX Inc. (WEX).
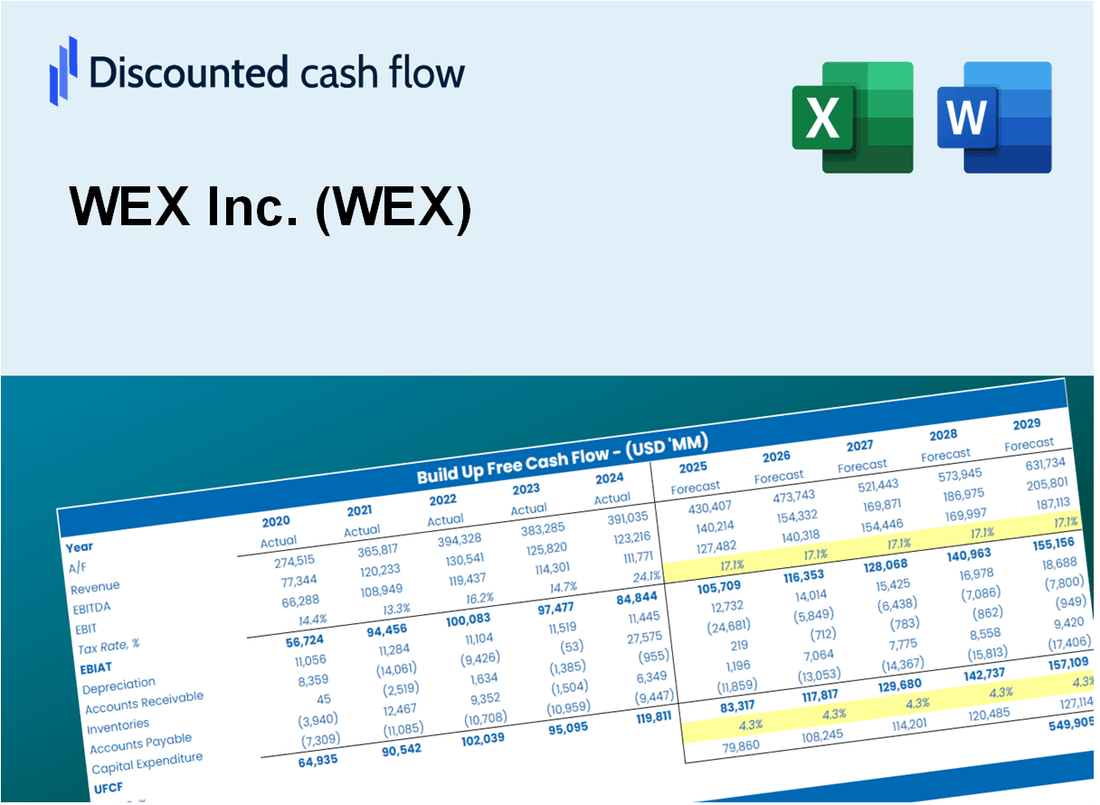
Discounted Cash Flow (DCF) - (USD MM)
| Year | AY1 2020 |
AY2 2021 |
AY3 2022 |
AY4 2023 |
AY5 2024 |
FY1 2025 |
FY2 2026 |
FY3 2027 |
FY4 2028 |
FY5 2029 |
|---|---|---|---|---|---|---|---|---|---|---|
| Revenue | 1,559.9 | 1,850.6 | 2,350.6 | 2,548.0 | 2,628.2 | 3,004.0 | 3,433.6 | 3,924.7 | 4,485.9 | 5,127.4 |
| Revenue Growth, % | 0 | 18.64 | 27.02 | 8.4 | 3.15 | 14.3 | 14.3 | 14.3 | 14.3 | 14.3 |
| EBITDA | 117.9 | 565.7 | 571.9 | 849.6 | 975.0 | 798.5 | 912.7 | 1,043.2 | 1,192.4 | 1,362.9 |
| EBITDA, % | 7.56 | 30.57 | 24.33 | 33.34 | 37.1 | 26.58 | 26.58 | 26.58 | 26.58 | 26.58 |
| Depreciation | 261.9 | 272.6 | 263.9 | 276.2 | 321.3 | 395.4 | 452.0 | 516.6 | 590.5 | 674.9 |
| Depreciation, % | 16.79 | 14.73 | 11.23 | 10.84 | 12.23 | 13.16 | 13.16 | 13.16 | 13.16 | 13.16 |
| EBIT | -144.0 | 293.1 | 308.0 | 573.4 | 653.7 | 403.1 | 460.7 | 526.6 | 601.9 | 688.0 |
| EBIT, % | -9.23 | 15.84 | 13.1 | 22.5 | 24.87 | 13.42 | 13.42 | 13.42 | 13.42 | 13.42 |
| Total Cash | 852.0 | 1,537.6 | 2,317.3 | 3,997.9 | 4,360.5 | 2,621.3 | 2,996.1 | 3,424.6 | 3,914.3 | 4,474.1 |
| Total Cash, percent | .0 | .0 | .0 | .0 | .0 | .0 | .0 | .0 | .0 | .0 |
| Account Receivables | 1,993.3 | 2,891.2 | 3,275.7 | 3,569.4 | 3,008.6 | 3,004.0 | 3,433.6 | 3,924.7 | 4,485.9 | 5,127.4 |
| Account Receivables, % | 127.79 | 156.23 | 139.35 | 140.09 | 114.47 | 100 | 100 | 100 | 100 | 100 |
| Inventories | 570.9 | 793.1 | 1,081.0 | .0 | .0 | 753.6 | 861.4 | 984.6 | 1,125.4 | 1,286.4 |
| Inventories, % | 36.6 | 42.86 | 45.99 | 0 | 0 | 25.09 | 25.09 | 25.09 | 25.09 | 25.09 |
| Accounts Payable | 778.2 | 1,021.9 | 1,225.0 | 1,323.6 | 952.7 | 1,474.5 | 1,685.4 | 1,926.4 | 2,201.9 | 2,516.7 |
| Accounts Payable, % | 49.89 | 55.22 | 52.11 | 51.95 | 36.25 | 49.08 | 49.08 | 49.08 | 49.08 | 49.08 |
| Capital Expenditure | -80.5 | -86.0 | -116.2 | -143.6 | -147.3 | -156.2 | -178.5 | -204.0 | -233.2 | -266.5 |
| Capital Expenditure, % | -5.16 | -4.65 | -4.94 | -5.64 | -5.6 | -5.2 | -5.2 | -5.2 | -5.2 | -5.2 |
| Tax Rate, % | 25.9 | 25.9 | 25.9 | 25.9 | 25.9 | 25.9 | 25.9 | 25.9 | 25.9 | 25.9 |
| EBITAT | -116.5 | .1 | 238.1 | 414.5 | 484.4 | 245.6 | 280.7 | 320.9 | 366.8 | 419.2 |
| Depreciation | ||||||||||
| Changes in Account Receivables | ||||||||||
| Changes in Inventories | ||||||||||
| Changes in Accounts Payable | ||||||||||
| Capital Expenditure | ||||||||||
| UFCF | -1,721.1 | -689.8 | -83.4 | 1,432.9 | 848.3 | 257.6 | 227.7 | 260.2 | 297.5 | 340.0 |
| WACC, % | 7.38 | 5.56 | 7.3 | 7.19 | 7.23 | 6.93 | 6.93 | 6.93 | 6.93 | 6.93 |
| PV UFCF | ||||||||||
| SUM PV UFCF | 1,123.6 | |||||||||
| Long Term Growth Rate, % | 2.00 | |||||||||
| Free cash flow (T + 1) | 347 | |||||||||
| Terminal Value | 7,035 | |||||||||
| Present Terminal Value | 5,032 | |||||||||
| Enterprise Value | 6,156 | |||||||||
| Net Debt | 3,850 | |||||||||
| Equity Value | 2,306 | |||||||||
| Diluted Shares Outstanding, MM | 41 | |||||||||
| Equity Value Per Share | 55.83 |
What You Will Get
- Real WEX Data: Preloaded financials – from revenue to EBIT – based on actual and projected figures.
- Full Customization: Adjust all critical parameters (yellow cells) like WACC, growth %, and tax rates.
- Instant Valuation Updates: Automatic recalculations to analyze the impact of changes on WEX's fair value.
- Versatile Excel Template: Tailored for quick edits, scenario testing, and detailed projections.
- Time-Saving and Accurate: Skip building models from scratch while maintaining precision and flexibility.
Key Features
- Real-Life WEX Data: Pre-filled with WEX Inc.'s historical financial information and future projections.
- Fully Customizable Inputs: Modify revenue growth rates, profit margins, WACC, tax rates, and capital expenditures.
- Dynamic Valuation Model: Automatic recalculations of Net Present Value (NPV) and intrinsic value based on user inputs.
- Scenario Testing: Develop multiple forecasting scenarios to evaluate various valuation results.
- User-Friendly Design: Intuitive layout, structured for both professionals and newcomers.
How It Works
- Step 1: Download the prebuilt Excel template featuring WEX Inc.'s [WEX] data.
- Step 2: Navigate through the pre-filled sheets to familiarize yourself with the essential metrics.
- Step 3: Adjust forecasts and assumptions in the editable yellow cells (WACC, growth, margins).
- Step 4: Instantly view recalculated results, including WEX Inc.'s intrinsic value.
- Step 5: Make informed investment decisions or create reports based on the outputs.
Why Choose This Calculator?
- Accurate Data: Real WEX financials ensure reliable valuation results.
- Customizable: Adjust key parameters like growth rates, WACC, and tax rates to match your projections.
- Time-Saving: Pre-built calculations eliminate the need to start from scratch.
- Professional-Grade Tool: Designed for investors, analysts, and consultants.
- User-Friendly: Intuitive layout and step-by-step instructions make it easy for all users.
Who Should Use This Product?
- Individual Investors: Make informed decisions about buying or selling WEX Inc. (WEX) stock.
- Financial Analysts: Streamline valuation processes with ready-to-use financial models for WEX Inc. (WEX).
- Consultants: Deliver professional valuation insights for WEX Inc. (WEX) to clients quickly and accurately.
- Business Owners: Understand how companies like WEX Inc. (WEX) are valued to guide your own strategy.
- Finance Students: Learn valuation techniques using real-world data and scenarios related to WEX Inc. (WEX).
What the Template Contains
- Comprehensive DCF Model: Editable template with detailed valuation calculations tailored for WEX Inc. (WEX).
- Real-World Data: WEX’s historical and projected financials preloaded for thorough analysis.
- Customizable Parameters: Adjust WACC, growth rates, and tax assumptions to explore various scenarios.
- Financial Statements: Complete annual and quarterly breakdowns for enhanced insights into WEX's performance.
- Key Ratios: Built-in analysis for profitability, efficiency, and leverage specific to WEX.
- Dashboard with Visual Outputs: Charts and tables designed for clear, actionable results related to WEX Inc. (WEX).
Disclaimer
All information, articles, and product details provided on this website are for general informational and educational purposes only. We do not claim any ownership over, nor do we intend to infringe upon, any trademarks, copyrights, logos, brand names, or other intellectual property mentioned or depicted on this site. Such intellectual property remains the property of its respective owners, and any references here are made solely for identification or informational purposes, without implying any affiliation, endorsement, or partnership.
We make no representations or warranties, express or implied, regarding the accuracy, completeness, or suitability of any content or products presented. Nothing on this website should be construed as legal, tax, investment, financial, medical, or other professional advice. In addition, no part of this site—including articles or product references—constitutes a solicitation, recommendation, endorsement, advertisement, or offer to buy or sell any securities, franchises, or other financial instruments, particularly in jurisdictions where such activity would be unlawful.
All content is of a general nature and may not address the specific circumstances of any individual or entity. It is not a substitute for professional advice or services. Any actions you take based on the information provided here are strictly at your own risk. You accept full responsibility for any decisions or outcomes arising from your use of this website and agree to release us from any liability in connection with your use of, or reliance upon, the content or products found herein.