
|
Cactus ، Inc. (WHD) تقييم DCF |
Fully Editable: Tailor To Your Needs In Excel Or Sheets
Professional Design: Trusted, Industry-Standard Templates
Investor-Approved Valuation Models
MAC/PC Compatible, Fully Unlocked
No Expertise Is Needed; Easy To Follow
Cactus, Inc. (WHD) Bundle
تبسيط تحليلك وتحسين الدقة من خلال حاسبة DCF (WHD)! مزودة ببيانات Cactus ، Inc. وافتراضات قابلة للتخصيص ، تمكنك هذه الأداة من التنبؤ وتحليل وقيمة Cactus ، Inc. مثل المستثمر المحنك.
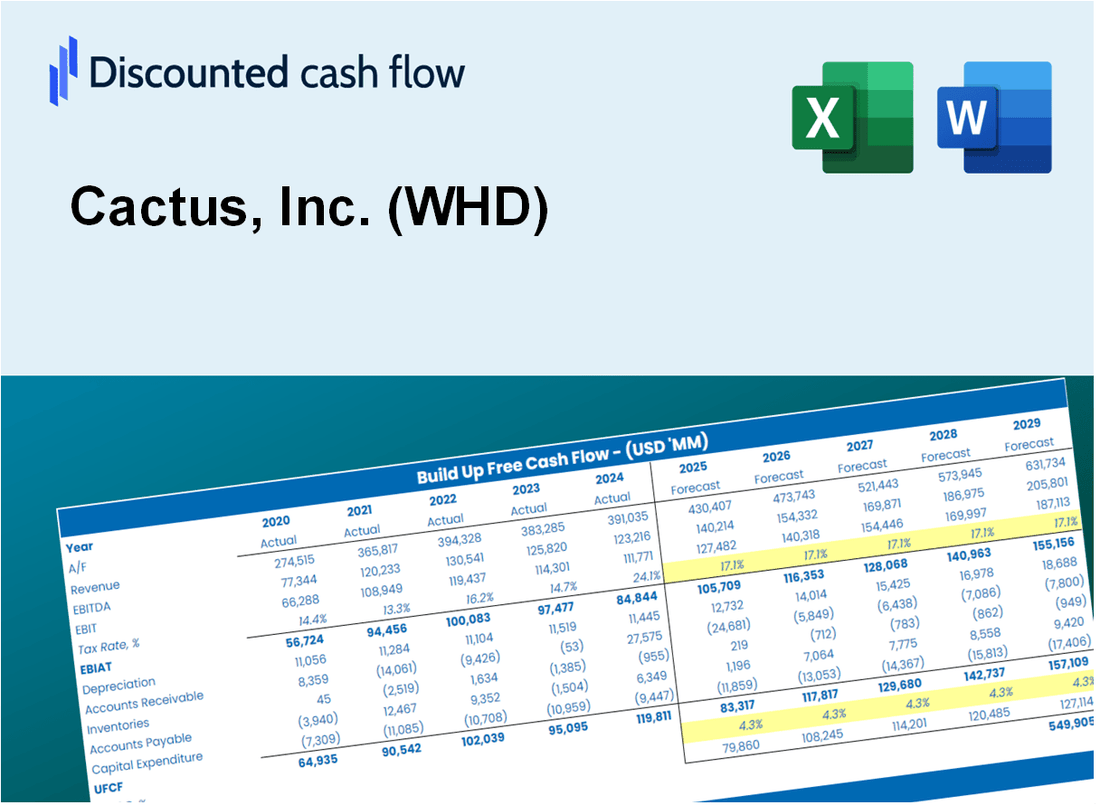
Discounted Cash Flow (DCF) - (USD MM)
| Year | AY1 2020 |
AY2 2021 |
AY3 2022 |
AY4 2023 |
AY5 2024 |
FY1 2025 |
FY2 2026 |
FY3 2027 |
FY4 2028 |
FY5 2029 |
|---|---|---|---|---|---|---|---|---|---|---|
| Revenue | 348.6 | 438.6 | 688.4 | 1,097.0 | 1,129.8 | 1,539.7 | 2,098.4 | 2,859.7 | 3,897.3 | 5,311.3 |
| Revenue Growth, % | 0 | 25.83 | 56.95 | 59.36 | 3 | 36.28 | 36.28 | 36.28 | 36.28 | 36.28 |
| EBITDA | 111.7 | 111.7 | 211.6 | 337.7 | 363.5 | 465.6 | 634.6 | 864.8 | 1,178.6 | 1,606.2 |
| EBITDA, % | 32.03 | 25.48 | 30.74 | 30.78 | 32.18 | 30.24 | 30.24 | 30.24 | 30.24 | 30.24 |
| Depreciation | 40.5 | 36.3 | 34.1 | 65.0 | 60.4 | 111.3 | 151.7 | 206.7 | 281.7 | 383.9 |
| Depreciation, % | 11.62 | 8.28 | 4.96 | 5.93 | 5.35 | 7.23 | 7.23 | 7.23 | 7.23 | 7.23 |
| EBIT | 71.1 | 75.4 | 177.4 | 272.6 | 303.1 | 354.3 | 482.9 | 658.1 | 896.9 | 1,222.3 |
| EBIT, % | 20.41 | 17.2 | 25.78 | 24.85 | 26.83 | 23.01 | 23.01 | 23.01 | 23.01 | 23.01 |
| Total Cash | 288.7 | 301.7 | 344.5 | 133.8 | 342.8 | 752.0 | 1,024.8 | 1,396.6 | 1,903.3 | 2,593.9 |
| Total Cash, percent | .0 | .0 | .0 | .0 | .0 | .0 | .0 | .0 | .0 | .0 |
| Account Receivables | 44.1 | 89.2 | 138.3 | 205.4 | 191.6 | 273.3 | 372.5 | 507.6 | 691.8 | 942.8 |
| Account Receivables, % | 12.64 | 20.34 | 20.09 | 18.72 | 16.96 | 17.75 | 17.75 | 17.75 | 17.75 | 17.75 |
| Inventories | 87.5 | 119.8 | 161.3 | 205.6 | 226.8 | 353.1 | 481.2 | 655.8 | 893.8 | 1,218.0 |
| Inventories, % | 25.1 | 27.32 | 23.43 | 18.74 | 20.07 | 22.93 | 22.93 | 22.93 | 22.93 | 22.93 |
| Accounts Payable | 20.2 | 42.8 | 47.8 | 71.8 | 72.0 | 109.0 | 148.6 | 202.5 | 276.0 | 376.1 |
| Accounts Payable, % | 5.78 | 9.76 | 6.94 | 6.55 | 6.37 | 7.08 | 7.08 | 7.08 | 7.08 | 7.08 |
| Capital Expenditure | -24.5 | -13.9 | -28.3 | -44.0 | -39.2 | -67.1 | -91.5 | -124.6 | -169.9 | -231.5 |
| Capital Expenditure, % | -7.03 | -3.18 | -4.11 | -4.01 | -3.47 | -4.36 | -4.36 | -4.36 | -4.36 | -4.36 |
| Tax Rate, % | 38.05 | 38.05 | 38.05 | 38.05 | 38.05 | 38.05 | 38.05 | 38.05 | 38.05 | 38.05 |
| EBITAT | 34.9 | 49.8 | 110.7 | 175.8 | 187.8 | 215.4 | 293.5 | 400.0 | 545.1 | 742.9 |
| Depreciation | ||||||||||
| Changes in Account Receivables | ||||||||||
| Changes in Inventories | ||||||||||
| Changes in Accounts Payable | ||||||||||
| Capital Expenditure | ||||||||||
| UFCF | -60.4 | 17.3 | 31.0 | 109.4 | 201.8 | 88.6 | 166.0 | 226.2 | 308.3 | 420.2 |
| WACC, % | 10.49 | 10.52 | 10.51 | 10.51 | 10.51 | 10.51 | 10.51 | 10.51 | 10.51 | 10.51 |
| PV UFCF | ||||||||||
| SUM PV UFCF | 845.4 | |||||||||
| Long Term Growth Rate, % | 3.50 | |||||||||
| Free cash flow (T + 1) | 435 | |||||||||
| Terminal Value | 6,204 | |||||||||
| Present Terminal Value | 3,764 | |||||||||
| Enterprise Value | 4,610 | |||||||||
| Net Debt | -301 | |||||||||
| Equity Value | 4,911 | |||||||||
| Diluted Shares Outstanding, MM | 80 | |||||||||
| Equity Value Per Share | 61.45 |
What You Will Get
- Pre-Filled Financial Model: Cactus, Inc. (WHD)’s actual data enables precise DCF valuation.
- Full Forecast Control: Adjust revenue growth, margins, WACC, and other key drivers.
- Instant Calculations: Automatic updates ensure you see results as you make changes.
- Investor-Ready Template: A refined Excel file designed for professional-grade valuation.
- Customizable and Reusable: Tailored for flexibility, allowing repeated use for detailed forecasts.
Key Features
- Accurate Cactus Financials: Gain access to reliable pre-loaded historical data and future forecasts.
- Adjustable Forecast Parameters: Modify highlighted cells for metrics like WACC, growth rates, and profit margins.
- Real-Time Calculations: Automatic updates for DCF, Net Present Value (NPV), and cash flow assessments.
- User-Friendly Dashboard: Clear charts and summaries to help visualize your valuation outcomes.
- Designed for All Skill Levels: An intuitive layout tailored for investors, CFOs, and consultants alike.
How It Works
- Step 1: Download the Excel file.
- Step 2: Review pre-entered Cactus, Inc. (WHD) data (historical and projected).
- Step 3: Adjust key assumptions (yellow cells) based on your analysis.
- Step 4: View automatic recalculations for Cactus, Inc. (WHD)’s intrinsic value.
- Step 5: Use the outputs for investment decisions or reporting.
Why Choose Cactus, Inc. (WHD) Calculator?
- Precision: Utilizes authentic Cactus financials for reliable data.
- Versatility: Tailored for users to easily adjust and explore different inputs.
- Efficiency: Avoid the complexities of creating a DCF model from the ground up.
- Expert-Level: Crafted with the expertise and functionality expected at the CFO level.
- Intuitive: Simple to navigate, making it accessible for those without extensive financial modeling skills.
Who Should Use This Product?
- Professional Investors: Develop comprehensive and accurate valuation models for investment assessments.
- Corporate Finance Teams: Evaluate valuation scenarios to inform company strategy and decision-making.
- Consultants and Advisors: Deliver precise valuation insights for Cactus, Inc. (WHD) to your clients.
- Students and Educators: Utilize real-world data to enhance learning and practice in financial modeling.
- Energy Sector Enthusiasts: Gain insights into how companies like Cactus, Inc. (WHD) are valued within the energy market.
What the Template Contains
- Pre-Filled Data: Includes Cactus, Inc.'s (WHD) historical financials and forecasts.
- Discounted Cash Flow Model: Editable DCF valuation model with automatic calculations.
- Weighted Average Cost of Capital (WACC): A dedicated sheet for calculating WACC based on custom inputs.
- Key Financial Ratios: Analyze Cactus, Inc.'s (WHD) profitability, efficiency, and leverage.
- Customizable Inputs: Edit revenue growth, margins, and tax rates with ease.
- Clear Dashboard: Charts and tables summarizing key valuation results.
Disclaimer
All information, articles, and product details provided on this website are for general informational and educational purposes only. We do not claim any ownership over, nor do we intend to infringe upon, any trademarks, copyrights, logos, brand names, or other intellectual property mentioned or depicted on this site. Such intellectual property remains the property of its respective owners, and any references here are made solely for identification or informational purposes, without implying any affiliation, endorsement, or partnership.
We make no representations or warranties, express or implied, regarding the accuracy, completeness, or suitability of any content or products presented. Nothing on this website should be construed as legal, tax, investment, financial, medical, or other professional advice. In addition, no part of this site—including articles or product references—constitutes a solicitation, recommendation, endorsement, advertisement, or offer to buy or sell any securities, franchises, or other financial instruments, particularly in jurisdictions where such activity would be unlawful.
All content is of a general nature and may not address the specific circumstances of any individual or entity. It is not a substitute for professional advice or services. Any actions you take based on the information provided here are strictly at your own risk. You accept full responsibility for any decisions or outcomes arising from your use of this website and agree to release us from any liability in connection with your use of, or reliance upon, the content or products found herein.