
|
WISA Technologies ، Inc. (WISA) DCF تقييم |
Fully Editable: Tailor To Your Needs In Excel Or Sheets
Professional Design: Trusted, Industry-Standard Templates
Investor-Approved Valuation Models
MAC/PC Compatible, Fully Unlocked
No Expertise Is Needed; Easy To Follow
WiSA Technologies, Inc. (WISA) Bundle
تكشف عن الإمكانات الحقيقية لـ WISA Technologies ، Inc. (WISA) مع حاسبة DCF المتقدمة! اضبط الافتراضات الهامة واستكشاف السيناريوهات المختلفة وتقييم كيفية تأثير التغييرات المختلفة على تقييم WISA - كل ذلك ضمن قالب Excel شامل.
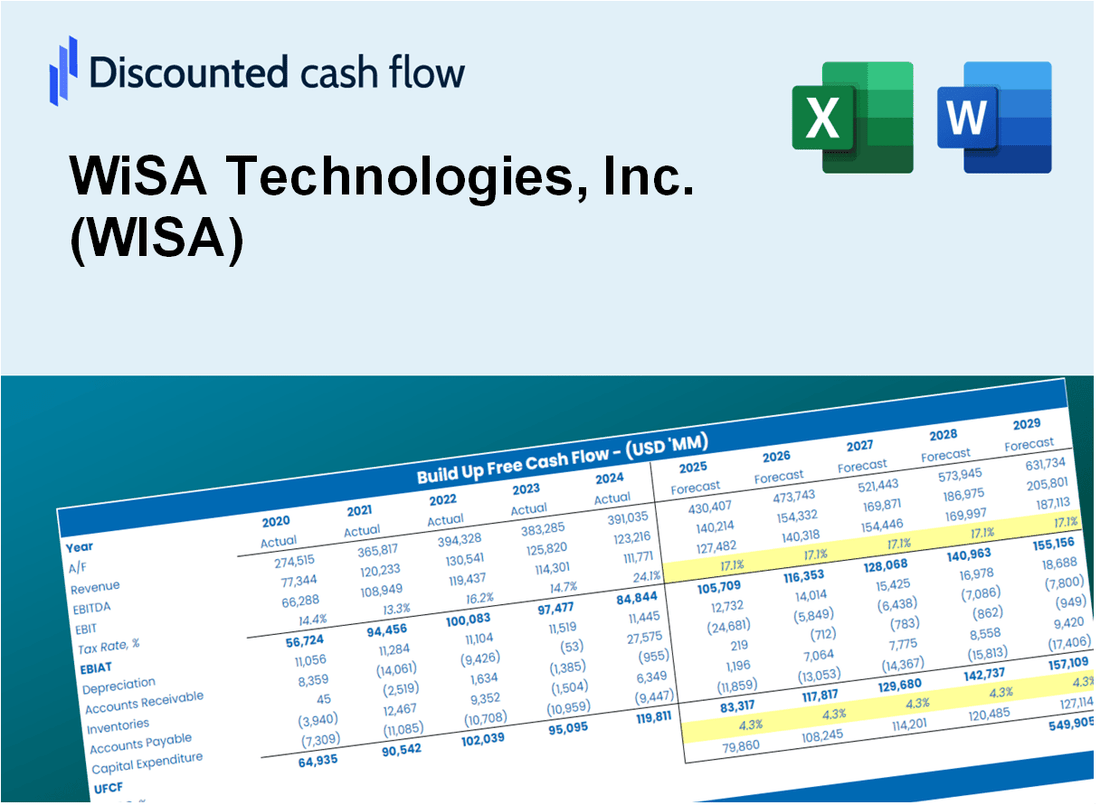
Discounted Cash Flow (DCF) - (USD MM)
| Year | AY1 2019 |
AY2 2020 |
AY3 2021 |
AY4 2022 |
AY5 2023 |
FY1 2024 |
FY2 2025 |
FY3 2026 |
FY4 2027 |
FY5 2028 |
|---|---|---|---|---|---|---|---|---|---|---|
| Revenue | 1.7 | 2.4 | 6.5 | 3.4 | 2.1 | 2.4 | 2.7 | 3.1 | 3.6 | 4.1 |
| Revenue Growth, % | 0 | 44.3 | 172.09 | -48.56 | -38.1 | 14.41 | 14.41 | 14.41 | 14.41 | 14.41 |
| EBITDA | -11.9 | -11.2 | -11.7 | -15.1 | -21.4 | -2.4 | -2.7 | -3.1 | -3.6 | -4.1 |
| EBITDA, % | -716.63 | -467.51 | -179.33 | -449.6 | -1025.4 | -100 | -100 | -100 | -100 | -100 |
| Depreciation | .1 | .1 | .1 | .1 | .1 | .1 | .1 | .1 | .1 | .2 |
| Depreciation, % | 5.46 | 3.91 | 1.21 | 3.63 | 4.7 | 3.78 | 3.78 | 3.78 | 3.78 | 3.78 |
| EBIT | -12.0 | -11.3 | -11.8 | -15.3 | -21.5 | -2.4 | -2.7 | -3.1 | -3.6 | -4.1 |
| EBIT, % | -722.09 | -471.42 | -180.54 | -453.22 | -1030.1 | -100 | -100 | -100 | -100 | -100 |
| Total Cash | .3 | 7.4 | 13.1 | 2.9 | .4 | 1.5 | 1.8 | 2.0 | 2.3 | 2.6 |
| Total Cash, percent | .0 | .0 | .0 | .0 | .0 | .0 | .0 | .0 | .0 | .0 |
| Account Receivables | .1 | .1 | .2 | .3 | .3 | .2 | .2 | .2 | .3 | .3 |
| Account Receivables, % | 6.48 | 3.54 | 3.27 | 8.11 | 14.11 | 7.1 | 7.1 | 7.1 | 7.1 | 7.1 |
| Inventories | 2.7 | 2.7 | 4.8 | 7.1 | 2.7 | 2.3 | 2.6 | 3.0 | 3.4 | 3.9 |
| Inventories, % | 160.02 | 112.65 | 73.08 | 210.1 | 131.4 | 94.62 | 94.62 | 94.62 | 94.62 | 94.62 |
| Accounts Payable | 1.6 | .7 | 1.5 | 2.0 | 2.3 | 1.5 | 1.7 | 1.9 | 2.2 | 2.5 |
| Accounts Payable, % | 93.28 | 27.95 | 23.68 | 60.68 | 111.38 | 61.12 | 61.12 | 61.12 | 61.12 | 61.12 |
| Capital Expenditure | .0 | -.1 | -.1 | .0 | -.1 | .0 | -.1 | -.1 | -.1 | -.1 |
| Capital Expenditure, % | -2.1 | -2.16 | -1.51 | -1.28 | -2.4 | -1.89 | -1.89 | -1.89 | -1.89 | -1.89 |
| Tax Rate, % | -0.02137095 | -0.02137095 | -0.02137095 | -0.02137095 | -0.02137095 | -0.02137095 | -0.02137095 | -0.02137095 | -0.02137095 | -0.02137095 |
| EBITAT | -12.0 | -11.3 | -11.8 | -15.3 | -21.5 | -2.4 | -2.7 | -3.1 | -3.6 | -4.1 |
| Depreciation | ||||||||||
| Changes in Account Receivables | ||||||||||
| Changes in Inventories | ||||||||||
| Changes in Accounts Payable | ||||||||||
| Capital Expenditure | ||||||||||
| UFCF | -13.2 | -12.2 | -13.2 | -17.0 | -16.8 | -2.6 | -2.8 | -3.2 | -3.7 | -4.2 |
| WACC, % | 133.68 | 133.68 | 133.68 | 133.68 | 133.68 | 133.68 | 133.68 | 133.68 | 133.68 | 133.68 |
| PV UFCF | ||||||||||
| SUM PV UFCF | -2.1 | |||||||||
| Long Term Growth Rate, % | 2.00 | |||||||||
| Free cash flow (T + 1) | -4 | |||||||||
| Terminal Value | -3 | |||||||||
| Present Terminal Value | 0 | |||||||||
| Enterprise Value | -2 | |||||||||
| Net Debt | 0 | |||||||||
| Equity Value | -2 | |||||||||
| Diluted Shares Outstanding, MM | 0 | |||||||||
| Equity Value Per Share | -32.25 |
What You Will Get
- Authentic WiSA Data: Preloaded financials – from revenue to EBIT – based on actual and projected figures.
- Comprehensive Customization: Modify all essential parameters (yellow cells) such as WACC, growth %, and tax rates.
- Instant Valuation Updates: Automatic recalculations to evaluate the effects of changes on WiSA Technologies’ fair value.
- Flexible Excel Template: Designed for quick adjustments, scenario testing, and detailed forecasts.
- Efficient and Precise: Avoid starting models from scratch while ensuring accuracy and adaptability.
Key Features
- 🔍 Real-Life WISA Financials: Pre-filled historical and projected data for WiSA Technologies, Inc. (WISA).
- ✏️ Fully Customizable Inputs: Adjust all critical parameters (yellow cells) like WACC, growth %, and tax rates.
- 📊 Professional DCF Valuation: Built-in formulas calculate WiSA’s intrinsic value using the Discounted Cash Flow method.
- ⚡ Instant Results: Visualize WiSA’s valuation instantly after making changes.
- Scenario Analysis: Test and compare outcomes for various financial assumptions side-by-side.
How It Works
- Download: Get the pre-prepared Excel file containing WiSA Technologies, Inc.'s (WISA) financial information.
- Customize: Modify projections, such as revenue growth, EBITDA %, and WACC.
- Update Automatically: The intrinsic value and NPV calculations refresh in real-time.
- Test Scenarios: Develop various forecasts and instantly compare the results.
- Make Decisions: Leverage the valuation findings to inform your investment approach.
Why Choose WiSA Technologies, Inc. (WISA) Calculator?
- Accuracy: Leverages real WiSA financial data for precise calculations.
- Flexibility: Allows users to experiment with and adjust inputs as needed.
- Time-Saving: Eliminate the need to create a financial model from the ground up.
- Professional-Grade: Crafted with the expertise and attention to detail expected at the CFO level.
- User-Friendly: Intuitive design makes it accessible for users without extensive financial modeling skills.
Who Should Use WiSA Technologies, Inc. (WISA)?
- Audio Engineers: Explore advanced wireless audio solutions and enhance your projects.
- Tech Enthusiasts: Stay updated on the latest innovations in wireless audio technology.
- Content Creators: Improve your production quality with state-of-the-art audio systems.
- Investors: Analyze market trends and evaluate investment opportunities in the tech sector.
- Home Theater Aficionados: Discover how WiSA technology can elevate your entertainment experience.
What the Template Contains
- Operating and Balance Sheet Data: Pre-filled WiSA Technologies historical data and forecasts, including revenue, EBITDA, EBIT, and capital expenditures.
- WACC Calculation: A dedicated sheet for Weighted Average Cost of Capital (WACC), including parameters like Beta, risk-free rate, and share price.
- DCF Valuation (Unlevered and Levered): Editable Discounted Cash Flow models showing intrinsic value with detailed calculations.
- Financial Statements: Pre-loaded financial statements (annual and quarterly) to support analysis.
- Key Ratios: Includes profitability, leverage, and efficiency ratios for WiSA Technologies, Inc. (WISA).
- Dashboard and Charts: Visual summary of valuation outputs and assumptions to analyze results easily.
Disclaimer
All information, articles, and product details provided on this website are for general informational and educational purposes only. We do not claim any ownership over, nor do we intend to infringe upon, any trademarks, copyrights, logos, brand names, or other intellectual property mentioned or depicted on this site. Such intellectual property remains the property of its respective owners, and any references here are made solely for identification or informational purposes, without implying any affiliation, endorsement, or partnership.
We make no representations or warranties, express or implied, regarding the accuracy, completeness, or suitability of any content or products presented. Nothing on this website should be construed as legal, tax, investment, financial, medical, or other professional advice. In addition, no part of this site—including articles or product references—constitutes a solicitation, recommendation, endorsement, advertisement, or offer to buy or sell any securities, franchises, or other financial instruments, particularly in jurisdictions where such activity would be unlawful.
All content is of a general nature and may not address the specific circumstances of any individual or entity. It is not a substitute for professional advice or services. Any actions you take based on the information provided here are strictly at your own risk. You accept full responsibility for any decisions or outcomes arising from your use of this website and agree to release us from any liability in connection with your use of, or reliance upon, the content or products found herein.