
|
Wheaton Precious Metals Corp. (WPM) DCF تقييم |
Fully Editable: Tailor To Your Needs In Excel Or Sheets
Professional Design: Trusted, Industry-Standard Templates
Investor-Approved Valuation Models
MAC/PC Compatible, Fully Unlocked
No Expertise Is Needed; Easy To Follow
Wheaton Precious Metals Corp. (WPM) Bundle
تبسيط تقييم Wheaton Precious Metals Corp. (WPM) مع هذه الآلة الحاسبة DCF القابلة للتخصيص! يتميز شركة Wheaton Precious Metals Corp.
What You Will Get
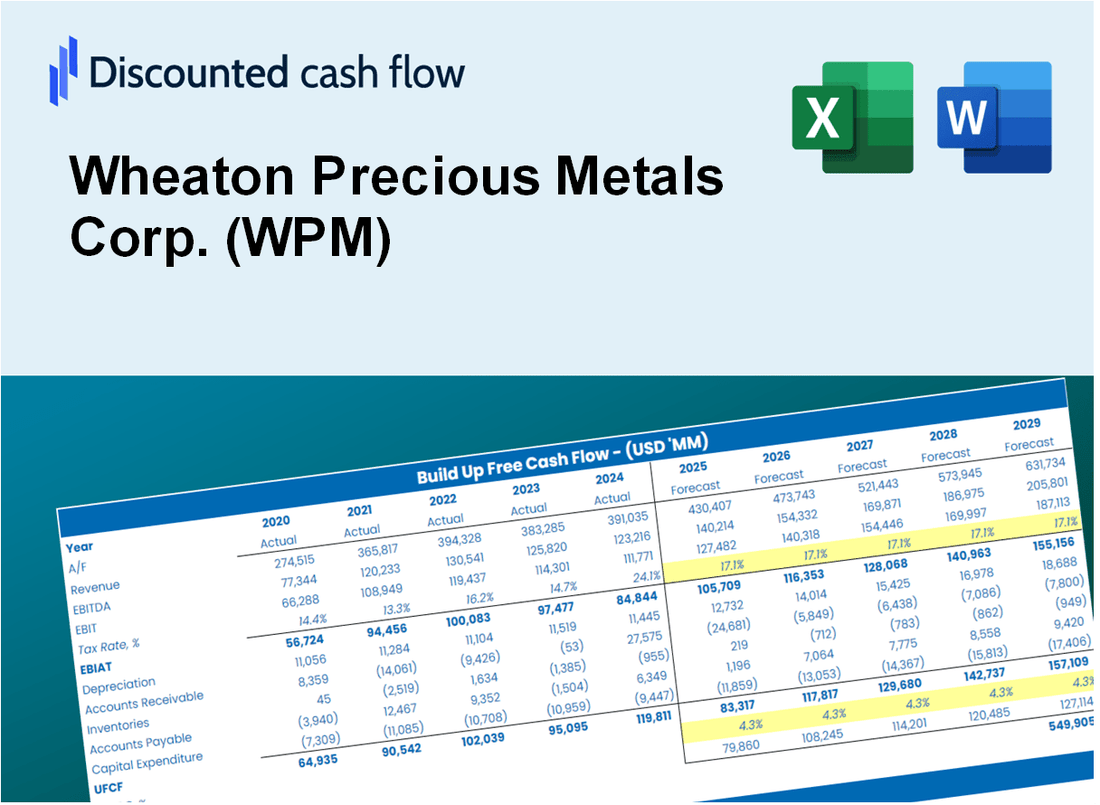
- Real Wheaton Precious Metals Data: Preloaded financials – from revenue to EBIT – based on actual and projected figures for Wheaton Precious Metals Corp. (WPM).
- Full Customization: Adjust all critical parameters (yellow cells) like WACC, growth %, and tax rates specific to Wheaton Precious Metals Corp. (WPM).
- Instant Valuation Updates: Automatic recalculations to analyze the impact of changes on Wheaton Precious Metals Corp. (WPM)’s fair value.
- Versatile Excel Template: Tailored for quick edits, scenario testing, and detailed projections for Wheaton Precious Metals Corp. (WPM).
- Time-Saving and Accurate: Skip building models from scratch while maintaining precision and flexibility for Wheaton Precious Metals Corp. (WPM).
Key Features
- Comprehensive Data: Wheaton Precious Metals Corp.'s historical financial statements and pre-filled projections.
- Customizable Inputs: Modify WACC, tax rates, revenue growth, and EBITDA margins to fit your analysis.
- Real-Time Insights: Observe Wheaton Precious Metals Corp.'s intrinsic value recalculating instantly.
- Intuitive Visuals: Dashboard charts illustrate valuation outcomes and essential metrics.
- Designed for Precision: A professional-grade tool for analysts, investors, and finance professionals.
How It Works
- Step 1: Download the prebuilt Excel template with Wheaton Precious Metals Corp.’s (WPM) data included.
- Step 2: Explore the pre-filled sheets and understand the key metrics related to (WPM).
- Step 3: Update forecasts and assumptions in the editable yellow cells (WACC, growth, margins) for (WPM).
- Step 4: Instantly view recalculated results, including Wheaton Precious Metals Corp.’s (WPM) intrinsic value.
- Step 5: Make informed investment decisions or generate reports using the outputs for (WPM).
Why Choose This Calculator for Wheaton Precious Metals Corp. (WPM)?
- Designed for Industry Experts: A sophisticated tool utilized by analysts, CFOs, and financial consultants.
- Comprehensive Data: Historical and projected financials for Wheaton Precious Metals preloaded for precision.
- Flexible Scenario Analysis: Effortlessly simulate various forecasts and assumptions.
- Insightful Outputs: Automatically computes intrinsic value, NPV, and essential financial metrics.
- User-Friendly: Step-by-step guidance ensures a smooth experience throughout the process.
Who Should Use This Product?
- Investors: Accurately assess Wheaton Precious Metals Corp.’s (WPM) intrinsic value prior to making investment choices.
- CFOs: Utilize a high-quality DCF model for financial reporting and comprehensive analysis.
- Consultants: Efficiently customize the template for client valuation reports.
- Entrepreneurs: Acquire knowledge on financial modeling practices employed by leading mining companies.
- Educators: Implement it as a resource for teaching valuation techniques and principles.
What the Template Contains
- Pre-Filled Data: Includes Wheaton Precious Metals Corp.'s (WPM) historical financials and forecasts.
- Discounted Cash Flow Model: Editable DCF valuation model with automatic calculations.
- Weighted Average Cost of Capital (WACC): A dedicated sheet for calculating WACC based on custom inputs.
- Key Financial Ratios: Analyze Wheaton Precious Metals Corp.'s (WPM) profitability, efficiency, and leverage.
- Customizable Inputs: Edit revenue growth, margins, and tax rates with ease.
- Clear Dashboard: Charts and tables summarizing key valuation results.
Disclaimer
All information, articles, and product details provided on this website are for general informational and educational purposes only. We do not claim any ownership over, nor do we intend to infringe upon, any trademarks, copyrights, logos, brand names, or other intellectual property mentioned or depicted on this site. Such intellectual property remains the property of its respective owners, and any references here are made solely for identification or informational purposes, without implying any affiliation, endorsement, or partnership.
We make no representations or warranties, express or implied, regarding the accuracy, completeness, or suitability of any content or products presented. Nothing on this website should be construed as legal, tax, investment, financial, medical, or other professional advice. In addition, no part of this site—including articles or product references—constitutes a solicitation, recommendation, endorsement, advertisement, or offer to buy or sell any securities, franchises, or other financial instruments, particularly in jurisdictions where such activity would be unlawful.
All content is of a general nature and may not address the specific circumstances of any individual or entity. It is not a substitute for professional advice or services. Any actions you take based on the information provided here are strictly at your own risk. You accept full responsibility for any decisions or outcomes arising from your use of this website and agree to release us from any liability in connection with your use of, or reliance upon, the content or products found herein.