
|
WinTrust Financial Corporation (WTFC) DCF تقييم |
Fully Editable: Tailor To Your Needs In Excel Or Sheets
Professional Design: Trusted, Industry-Standard Templates
Investor-Approved Valuation Models
MAC/PC Compatible, Fully Unlocked
No Expertise Is Needed; Easy To Follow
Wintrust Financial Corporation (WTFC) Bundle
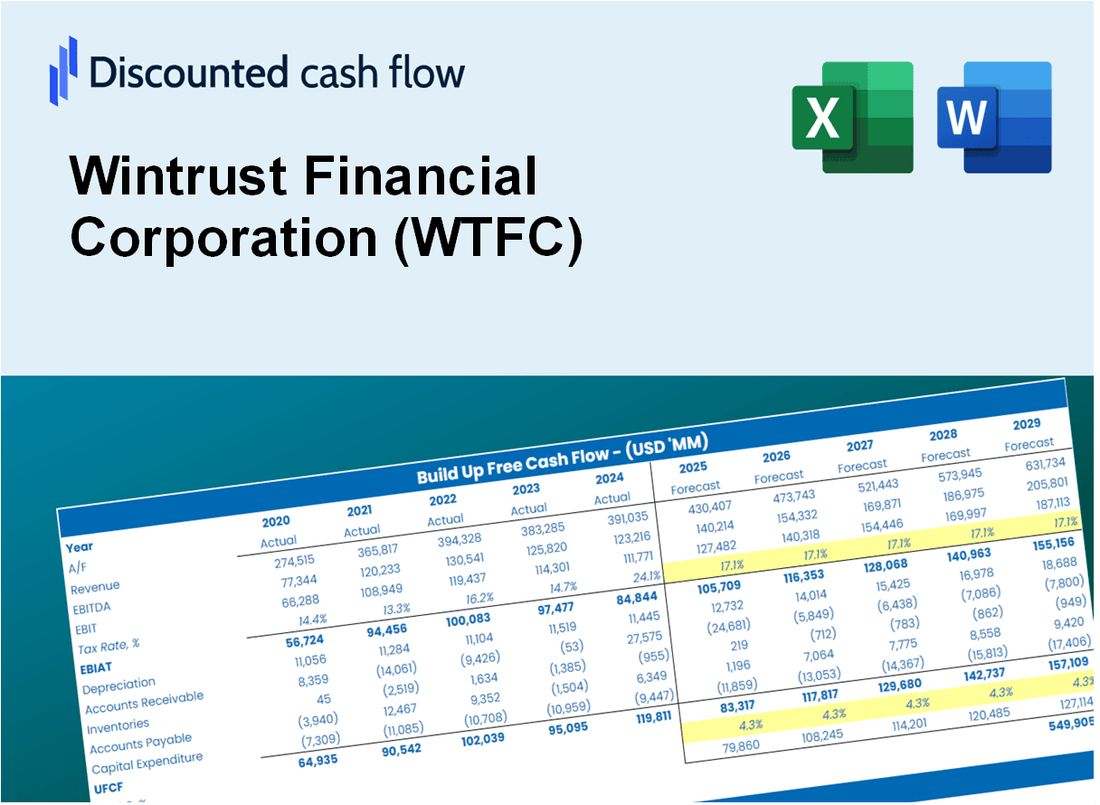
تقييم التوقعات المالية لشركة WinTrust Financial Corporation (WTFC) مثل خبير! توفر لك حاسبة DCF (WTFC) هذه البيانات المالية المليئة مسبقًا والمرونة في تخصيص نمو الإيرادات ، و WACC ، والهوامش ، وغيرها من الافتراضات الأساسية التي تتماشى مع تنبؤاتك.
What You Will Get
- Editable Forecast Inputs: Easily adjust assumptions (growth %, margins, WACC) to explore various scenarios.
- Real-World Data: Wintrust Financial Corporation’s (WTFC) financial data pre-filled to accelerate your analysis.
- Automatic DCF Outputs: The template computes Net Present Value (NPV) and intrinsic value effortlessly.
- Customizable and Professional: A sleek Excel model that tailors to your valuation requirements.
- Built for Analysts and Investors: Perfect for testing projections, validating strategies, and enhancing efficiency.
Key Features
- Customizable Financial Inputs: Adjust essential metrics such as loan growth, net interest margin, and operating expenses.
- Instant DCF Calculations: Provides quick assessments of intrinsic value, NPV, and additional financial metrics.
- High-Precision Valuations: Leverages Wintrust’s actual financial data for accurate valuation results.
- Streamlined Scenario Analysis: Easily explore various scenarios and evaluate their impacts side by side.
- Efficiency Booster: Avoid the hassle of constructing intricate valuation models from the ground up.
How It Works
- 1. Access the Template: Download and open the Excel file containing Wintrust Financial Corporation’s (WTFC) preloaded data.
- 2. Modify Assumptions: Adjust key inputs such as growth rates, WACC, and capital expenditures.
- 3. Instant Results: The DCF model automatically calculates intrinsic value and NPV in real-time.
- 4. Explore Scenarios: Evaluate various forecasts to assess different valuation outcomes.
- 5. Present with Assurance: Deliver professional valuation insights to back your financial decisions.
Why Choose Wintrust Financial Corporation (WTFC)?
- Save Time: Quickly access comprehensive financial solutions without the hassle of starting from scratch.
- Enhance Precision: Our reliable data and methodologies minimize errors in your financial assessments.
- Completely Customizable: Adjust our services to meet your specific financial goals and projections.
- User-Friendly Interface: Intuitive tools and visualizations simplify the analysis of your financial results.
- Trusted by Professionals: Endorsed by industry experts who prioritize accuracy and efficiency.
Who Should Use Wintrust Financial Corporation (WTFC)?
- Professional Investors: Develop comprehensive and accurate valuation models for investment analysis.
- Corporate Finance Teams: Evaluate valuation scenarios to inform strategic decision-making.
- Consultants and Advisors: Deliver precise valuation insights for Wintrust Financial Corporation (WTFC) to clients.
- Students and Educators: Utilize real-world data to enhance learning and practice in financial modeling.
- Banking Enthusiasts: Gain insights into how financial institutions like Wintrust Financial Corporation (WTFC) are valued in the market.
What the Template Contains
- Comprehensive DCF Model: Editable template featuring detailed valuation calculations.
- Real-World Data: Wintrust Financial Corporation’s (WTFC) historical and projected financials preloaded for analysis.
- Customizable Parameters: Adjust WACC, growth rates, and tax assumptions to explore different scenarios.
- Financial Statements: Complete annual and quarterly breakdowns for enhanced insights.
- Key Ratios: Integrated analysis for profitability, efficiency, and leverage metrics.
- Dashboard with Visual Outputs: Charts and tables for clear, actionable insights.
Disclaimer
All information, articles, and product details provided on this website are for general informational and educational purposes only. We do not claim any ownership over, nor do we intend to infringe upon, any trademarks, copyrights, logos, brand names, or other intellectual property mentioned or depicted on this site. Such intellectual property remains the property of its respective owners, and any references here are made solely for identification or informational purposes, without implying any affiliation, endorsement, or partnership.
We make no representations or warranties, express or implied, regarding the accuracy, completeness, or suitability of any content or products presented. Nothing on this website should be construed as legal, tax, investment, financial, medical, or other professional advice. In addition, no part of this site—including articles or product references—constitutes a solicitation, recommendation, endorsement, advertisement, or offer to buy or sell any securities, franchises, or other financial instruments, particularly in jurisdictions where such activity would be unlawful.
All content is of a general nature and may not address the specific circumstances of any individual or entity. It is not a substitute for professional advice or services. Any actions you take based on the information provided here are strictly at your own risk. You accept full responsibility for any decisions or outcomes arising from your use of this website and agree to release us from any liability in connection with your use of, or reliance upon, the content or products found herein.