
|
White Mountains Insurance Group ، Ltd. (WTM) DCF تقييم |
Fully Editable: Tailor To Your Needs In Excel Or Sheets
Professional Design: Trusted, Industry-Standard Templates
Investor-Approved Valuation Models
MAC/PC Compatible, Fully Unlocked
No Expertise Is Needed; Easy To Follow
White Mountains Insurance Group, Ltd. (WTM) Bundle
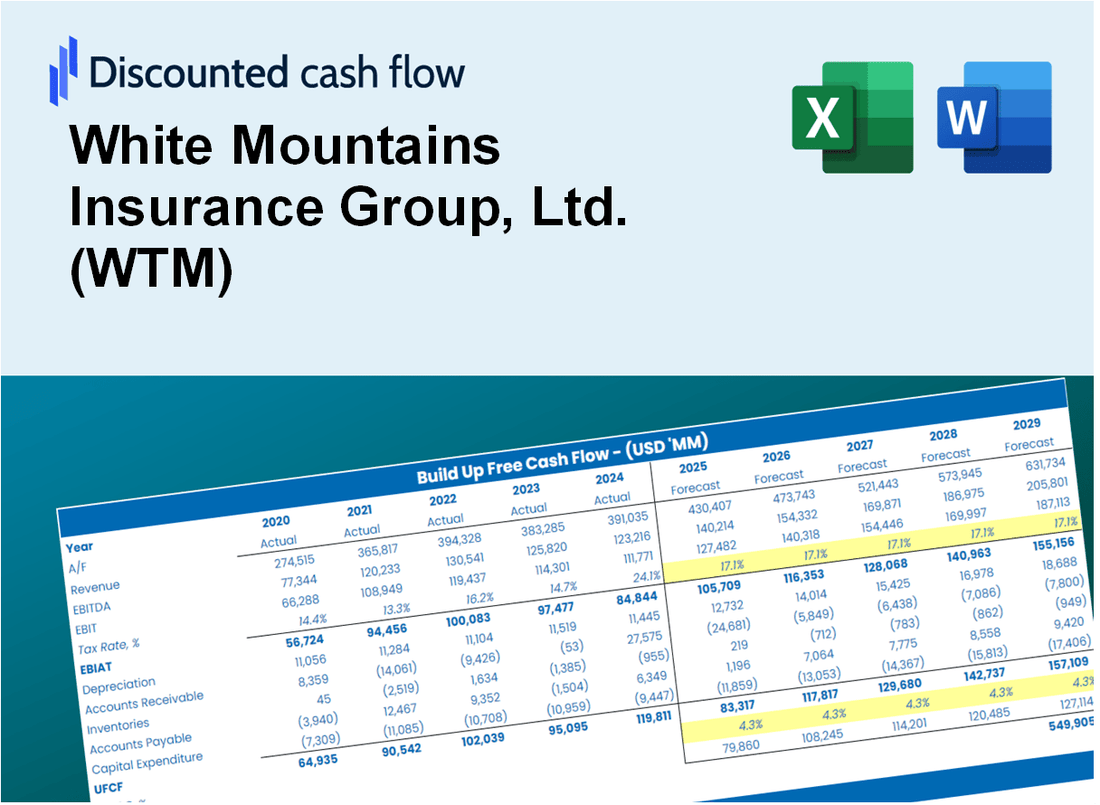
سواء كنت مستثمرًا أو محللًا ، فإن حاسبة DCF (WTM) هذه هي أداةك الأساسية للتقييم الدقيق. تم تحميلها مسبقًا ببيانات حقيقية من White Mountains Insurance Group ، Ltd. ، يمكنك ضبط التوقعات ومراقبة التأثيرات على الفور.
Discounted Cash Flow (DCF) - (USD MM)
| Year | AY1 2020 |
AY2 2021 |
AY3 2022 |
AY4 2023 |
AY5 2024 |
FY1 2025 |
FY2 2026 |
FY3 2027 |
FY4 2028 |
FY5 2029 |
|---|---|---|---|---|---|---|---|---|---|---|
| Revenue | 895.6 | 614.4 | 1,157.9 | 2,166.7 | 2,354.3 | 3,253.9 | 4,497.2 | 6,215.7 | 8,590.8 | 11,873.4 |
| Revenue Growth, % | 0 | -31.4 | 88.46 | 87.12 | 8.66 | 38.21 | 38.21 | 38.21 | 38.21 | 38.21 |
| EBITDA | 677.4 | -231.5 | -104.8 | 610.3 | 371.1 | 474.0 | 655.1 | 905.5 | 1,251.4 | 1,729.6 |
| EBITDA, % | 75.64 | -37.68 | -9.05 | 28.17 | 15.76 | 14.57 | 14.57 | 14.57 | 14.57 | 14.57 |
| Depreciation | 9.6 | 21.6 | 4.3 | -17.8 | -6.4 | 25.2 | 34.8 | 48.1 | 66.4 | 91.8 |
| Depreciation, % | 1.07 | 3.52 | 0.37136 | -0.82153 | -0.27184 | 0.77311 | 0.77311 | 0.77311 | 0.77311 | 0.77311 |
| EBIT | 667.8 | -253.1 | -109.1 | 628.1 | 377.5 | 448.8 | 620.4 | 857.4 | 1,185.0 | 1,637.8 |
| EBIT, % | 74.56 | -41.19 | -9.42 | 28.99 | 16.03 | 13.79 | 13.79 | 13.79 | 13.79 | 13.79 |
| Total Cash | 354.1 | 605.8 | 1,179.1 | 1,609.6 | 1,216.5 | 2,369.5 | 3,274.9 | 4,526.2 | 6,255.8 | 8,646.1 |
| Total Cash, percent | .0 | .0 | .0 | .0 | .0 | .0 | .0 | .0 | .0 | .0 |
| Account Receivables | .0 | 157.6 | .0 | .0 | 1,829.0 | 672.5 | 929.5 | 1,284.6 | 1,775.5 | 2,454.0 |
| Account Receivables, % | 0 | 25.65 | 0 | 0 | 77.69 | 20.67 | 20.67 | 20.67 | 20.67 | 20.67 |
| Inventories | .0 | .0 | .0 | .0 | .0 | .0 | .0 | .0 | .0 | .0 |
| Inventories, % | 0 | 0 | 0 | 0 | 0 | 0 | 0 | 0 | 0 | 0 |
| Accounts Payable | 113.4 | 424.1 | 251.1 | 81.1 | 237.6 | 762.8 | 1,054.2 | 1,457.1 | 2,013.8 | 2,783.3 |
| Accounts Payable, % | 12.66 | 69.03 | 21.69 | 3.74 | 10.09 | 23.44 | 23.44 | 23.44 | 23.44 | 23.44 |
| Capital Expenditure | .0 | .0 | .0 | .0 | .0 | .0 | .0 | .0 | .0 | .0 |
| Capital Expenditure, % | 0 | 0 | 0 | 0 | 0 | 0 | 0 | 0 | 0 | 0 |
| Tax Rate, % | 27.25 | 27.25 | 27.25 | 27.25 | 27.25 | 27.25 | 27.25 | 27.25 | 27.25 | 27.25 |
| EBITAT | 716.6 | -254.8 | 578.9 | 565.7 | 274.6 | 325.7 | 450.1 | 622.2 | 859.9 | 1,188.4 |
| Depreciation | ||||||||||
| Changes in Account Receivables | ||||||||||
| Changes in Inventories | ||||||||||
| Changes in Accounts Payable | ||||||||||
| Capital Expenditure | ||||||||||
| UFCF | 839.6 | -80.1 | 567.8 | 377.9 | -1,404.3 | 2,032.5 | 519.4 | 717.9 | 992.2 | 1,371.3 |
| WACC, % | 6.01 | 6.01 | 4.89 | 5.9 | 5.7 | 5.7 | 5.7 | 5.7 | 5.7 | 5.7 |
| PV UFCF | ||||||||||
| SUM PV UFCF | 4,829.8 | |||||||||
| Long Term Growth Rate, % | 2.00 | |||||||||
| Free cash flow (T + 1) | 1,399 | |||||||||
| Terminal Value | 37,797 | |||||||||
| Present Terminal Value | 28,646 | |||||||||
| Enterprise Value | 33,476 | |||||||||
| Net Debt | 310 | |||||||||
| Equity Value | 33,166 | |||||||||
| Diluted Shares Outstanding, MM | 3 | |||||||||
| Equity Value Per Share | 13,098.68 |
What You Will Receive
- Comprehensive Financial Model: Leverage White Mountains Insurance Group's (WTM) actual data for accurate DCF valuation.
- Complete Forecasting Flexibility: Modify revenue growth, profit margins, WACC, and other essential metrics.
- Real-Time Calculations: Automatic updates provide immediate feedback as you adjust inputs.
- Professional-Grade Template: An expertly crafted Excel file suitable for high-quality valuations.
- Adaptable and Reusable: Designed for versatility, enabling ongoing use for in-depth financial forecasts.
Key Features
- Comprehensive DCF Calculator: Features detailed unlevered and levered DCF valuation models tailored for White Mountains Insurance Group, Ltd. (WTM).
- WACC Calculator: Pre-designed Weighted Average Cost of Capital sheet with adjustable inputs specific to the insurance sector.
- Customizable Forecast Assumptions: Adjust growth rates, capital expenditures, and discount rates to fit your analysis needs.
- Integrated Financial Ratios: Evaluate profitability, leverage, and efficiency ratios for White Mountains Insurance Group, Ltd. (WTM).
- Interactive Dashboard and Charts: Visual representations summarize essential valuation metrics for straightforward analysis.
How It Works
- Step 1: Download the Excel file for White Mountains Insurance Group, Ltd. (WTM).
- Step 2: Review the pre-filled financial data and forecasts for (WTM).
- Step 3: Adjust key inputs such as premium growth, expense ratios, and investment returns (highlighted cells).
- Step 4: Observe the DCF model update in real-time as you modify your assumptions.
- Step 5: Evaluate the outputs and leverage the results for your investment strategies.
Why Choose This Calculator?
- User-Friendly Interface: Perfect for both novices and seasoned professionals.
- Customizable Inputs: Adjust parameters to suit your specific analysis needs.
- Real-Time Feedback: Watch immediate changes in White Mountains Insurance Group's valuation as you modify inputs.
- Preloaded Data: Comes with White Mountains Insurance Group's actual financial metrics for swift evaluations.
- Relied Upon by Experts: Favored by investors and analysts for making well-informed choices.
Who Should Use White Mountains Insurance Group, Ltd. (WTM)?
- Investors: Gain insights into insurance investments with a reliable analysis tool.
- Financial Analysts: Streamline your evaluation process with comprehensive financial models tailored for the insurance sector.
- Consultants: Easily modify reports and presentations to meet client needs in the insurance industry.
- Insurance Professionals: Enhance your knowledge of insurance market dynamics through practical examples.
- Educators and Students: Utilize it as a resource for learning about insurance finance in academic settings.
What the Template Contains
- Pre-Filled Data: Contains White Mountains Insurance Group's historical financials and projections.
- Discounted Cash Flow Model: Editable DCF valuation model featuring automatic calculations.
- Weighted Average Cost of Capital (WACC): A dedicated sheet for calculating WACC using custom inputs.
- Key Financial Ratios: Assess White Mountains Insurance Group's profitability, efficiency, and leverage.
- Customizable Inputs: Easily adjust revenue growth, margins, and tax rates.
- Clear Dashboard: Visualizations and tables summarizing essential valuation outcomes.
Disclaimer
All information, articles, and product details provided on this website are for general informational and educational purposes only. We do not claim any ownership over, nor do we intend to infringe upon, any trademarks, copyrights, logos, brand names, or other intellectual property mentioned or depicted on this site. Such intellectual property remains the property of its respective owners, and any references here are made solely for identification or informational purposes, without implying any affiliation, endorsement, or partnership.
We make no representations or warranties, express or implied, regarding the accuracy, completeness, or suitability of any content or products presented. Nothing on this website should be construed as legal, tax, investment, financial, medical, or other professional advice. In addition, no part of this site—including articles or product references—constitutes a solicitation, recommendation, endorsement, advertisement, or offer to buy or sell any securities, franchises, or other financial instruments, particularly in jurisdictions where such activity would be unlawful.
All content is of a general nature and may not address the specific circumstances of any individual or entity. It is not a substitute for professional advice or services. Any actions you take based on the information provided here are strictly at your own risk. You accept full responsibility for any decisions or outcomes arising from your use of this website and agree to release us from any liability in connection with your use of, or reliance upon, the content or products found herein.