
|
فنادق زينيا & Resorts ، Inc. (XHR) تقييم DCF |
Fully Editable: Tailor To Your Needs In Excel Or Sheets
Professional Design: Trusted, Industry-Standard Templates
Investor-Approved Valuation Models
MAC/PC Compatible, Fully Unlocked
No Expertise Is Needed; Easy To Follow
Xenia Hotels & Resorts, Inc. (XHR) Bundle
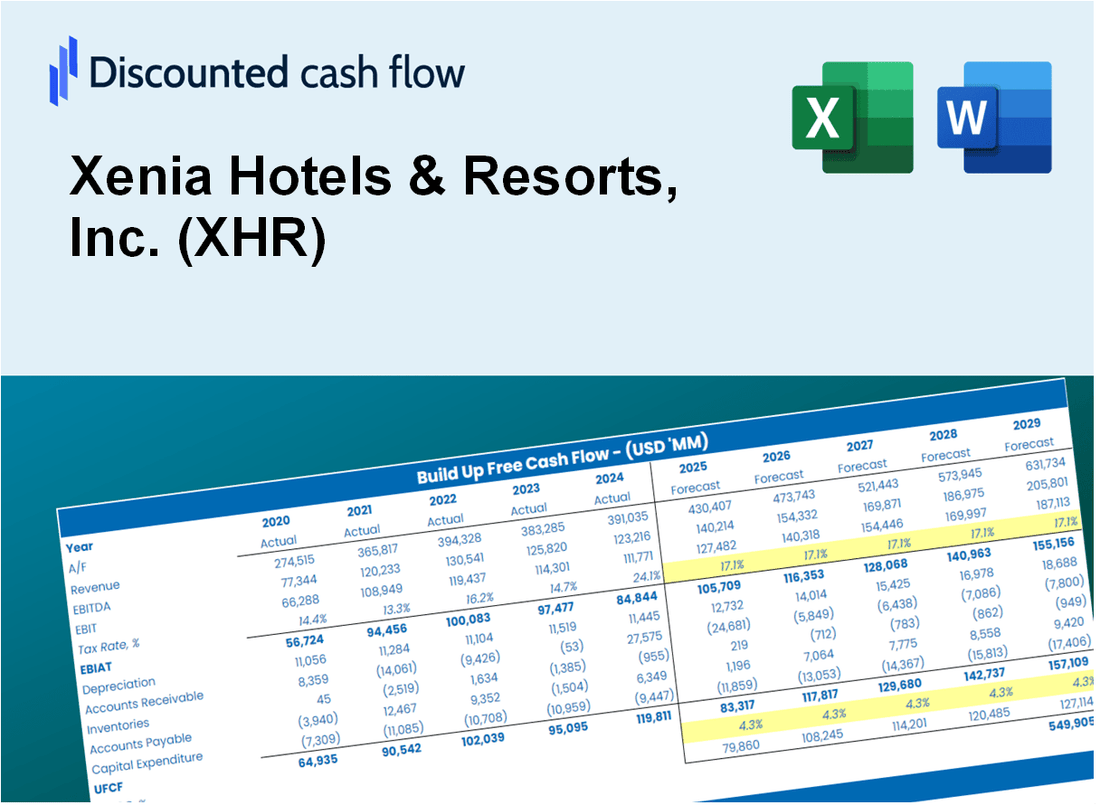
تتطلع إلى تقييم القيمة الجوهرية لفنادق Xenia & Resorts ، Inc.؟ يدمج حاسبة DCF (XHR) DCF بيانات العالم الحقيقي مع ميزات تخصيص واسعة ، مما يتيح لك ضبط التوقعات وتعزيز استراتيجية الاستثمار الخاصة بك.
What You Will Receive
- Comprehensive Financial Model: Xenia Hotels & Resorts, Inc.'s (XHR) actual data provides an accurate DCF valuation.
- Complete Forecast Flexibility: Modify revenue growth, profit margins, WACC, and other critical factors.
- Real-Time Calculations: Automatic updates allow you to view results instantly as adjustments are made.
- Professional-Grade Template: A polished Excel file crafted for high-quality valuation presentations.
- Adaptable and Reusable: Designed for versatility, enabling repeated applications for in-depth forecasts.
Key Features
- Comprehensive Data: Xenia Hotels & Resorts, Inc. (XHR) provides detailed historical financials and predictive forecasts.
- Customizable Parameters: Adjust inputs for WACC, tax rates, revenue growth, and EBITDA margins to suit your analysis.
- Real-Time Insights: Instantly view the recalculated intrinsic value of Xenia Hotels & Resorts, Inc. (XHR).
- Intuitive Visualizations: Engaging dashboard charts showcase valuation outcomes and essential metrics.
- Designed for Precision: A reliable resource tailored for analysts, investors, and finance professionals.
How It Works
- Step 1: Download the prebuilt Excel template featuring Xenia Hotels & Resorts, Inc. (XHR) data.
- Step 2: Navigate through the pre-filled sheets to grasp the essential metrics.
- Step 3: Modify forecasts and assumptions in the editable yellow cells (WACC, growth, margins).
- Step 4: Instantly observe recalculated results, including Xenia Hotels & Resorts, Inc.'s (XHR) intrinsic value.
- Step 5: Make well-informed investment decisions or create reports based on the outputs.
Why Choose Xenia Hotels & Resorts, Inc. (XHR)?
- Maximize Efficiency: No need to build a hotel valuation model from the ground up – it’s readily available.
- Enhance Precision: Dependable hospitality data and metrics minimize inaccuracies in property assessments.
- Completely Adaptable: Modify the model to align with your specific market insights and forecasts.
- User-Friendly Insights: Intuitive graphs and outputs simplify the analysis of your investment results.
- Endorsed by Industry Leaders: Crafted for professionals who prioritize accuracy and functionality.
Who Should Use This Product?
- Individual Investors: Make informed decisions about buying or selling Xenia Hotels & Resorts, Inc. (XHR) stock.
- Financial Analysts: Streamline valuation processes with ready-to-use financial models specific to Xenia Hotels & Resorts, Inc. (XHR).
- Consultants: Deliver professional valuation insights for Xenia Hotels & Resorts, Inc. (XHR) to clients quickly and accurately.
- Business Owners: Understand how hospitality companies like Xenia Hotels & Resorts, Inc. (XHR) are valued to guide your own strategy.
- Finance Students: Learn valuation techniques using real-world data and scenarios related to Xenia Hotels & Resorts, Inc. (XHR).
What the Template Contains
- Comprehensive DCF Model: Editable template featuring detailed valuation calculations tailored for Xenia Hotels & Resorts, Inc. (XHR).
- Real-World Data: Historical and projected financials for Xenia Hotels preloaded for in-depth analysis.
- Customizable Parameters: Modify WACC, growth rates, and tax assumptions to explore various scenarios.
- Financial Statements: Complete annual and quarterly breakdowns providing deeper insights into XHR's performance.
- Key Ratios: Integrated analysis for assessing profitability, efficiency, and leverage specific to Xenia Hotels.
- Dashboard with Visual Outputs: Interactive charts and tables for presenting clear, actionable results.
Disclaimer
All information, articles, and product details provided on this website are for general informational and educational purposes only. We do not claim any ownership over, nor do we intend to infringe upon, any trademarks, copyrights, logos, brand names, or other intellectual property mentioned or depicted on this site. Such intellectual property remains the property of its respective owners, and any references here are made solely for identification or informational purposes, without implying any affiliation, endorsement, or partnership.
We make no representations or warranties, express or implied, regarding the accuracy, completeness, or suitability of any content or products presented. Nothing on this website should be construed as legal, tax, investment, financial, medical, or other professional advice. In addition, no part of this site—including articles or product references—constitutes a solicitation, recommendation, endorsement, advertisement, or offer to buy or sell any securities, franchises, or other financial instruments, particularly in jurisdictions where such activity would be unlawful.
All content is of a general nature and may not address the specific circumstances of any individual or entity. It is not a substitute for professional advice or services. Any actions you take based on the information provided here are strictly at your own risk. You accept full responsibility for any decisions or outcomes arising from your use of this website and agree to release us from any liability in connection with your use of, or reliance upon, the content or products found herein.