
|
Exxon Mobil Corporation (XOM) تقييم DCF |
Fully Editable: Tailor To Your Needs In Excel Or Sheets
Professional Design: Trusted, Industry-Standard Templates
Investor-Approved Valuation Models
MAC/PC Compatible, Fully Unlocked
No Expertise Is Needed; Easy To Follow
Exxon Mobil Corporation (XOM) Bundle
عزز استراتيجيات الاستثمار الخاصة بك مع حاسبة Exxon Mobil Corporation (XOM) DCF! الغوص في البيانات المالية exxon الأصلية ، وضبط تنبؤات النمو والنفقات ، ومراقبة كيف تؤثر هذه التعديلات على تقييم القيمة الجوهرية لشركة Exxon Mobil (XOM) في الوقت الفعلي.
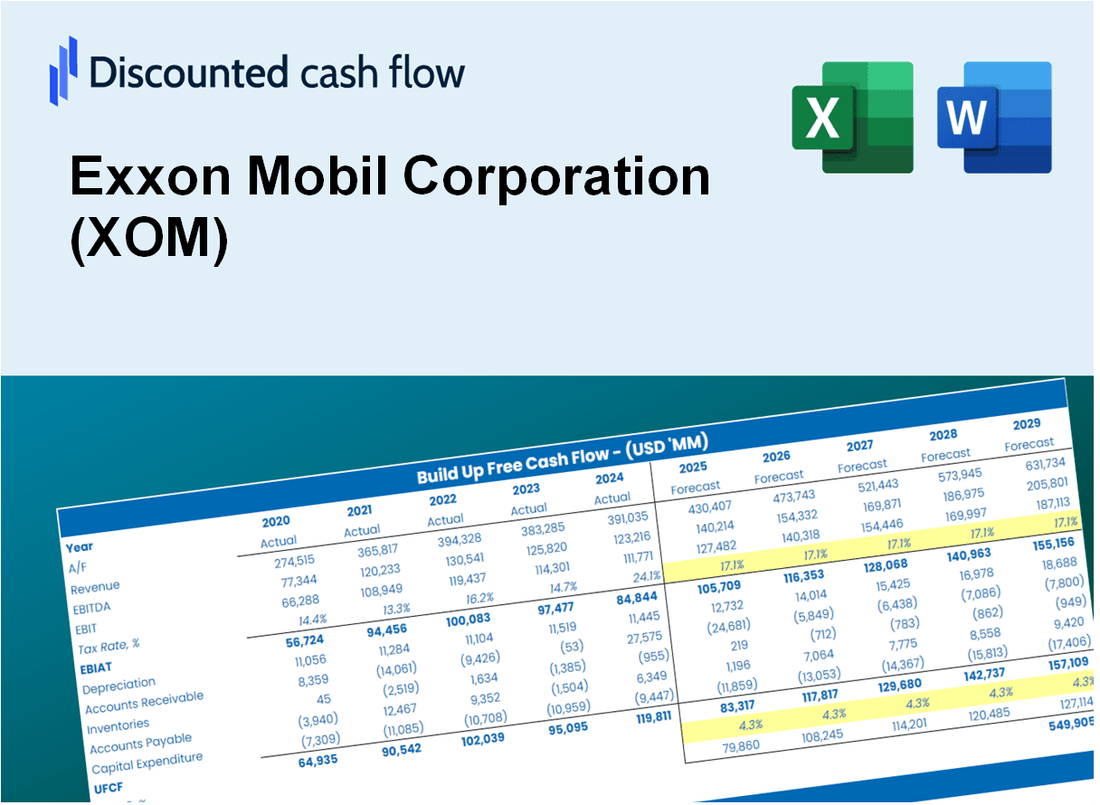
Discounted Cash Flow (DCF) - (USD MM)
| Year | AY1 2020 |
AY2 2021 |
AY3 2022 |
AY4 2023 |
AY5 2024 |
FY1 2025 |
FY2 2026 |
FY3 2027 |
FY4 2028 |
FY5 2029 |
|---|---|---|---|---|---|---|---|---|---|---|
| Revenue | 178,574.0 | 276,692.0 | 398,675.0 | 334,697.0 | 339,247.0 | 410,780.0 | 497,396.3 | 602,276.4 | 729,271.3 | 883,044.2 |
| Revenue Growth, % | 0 | 54.95 | 44.09 | -16.05 | 1.36 | 21.09 | 21.09 | 21.09 | 21.09 | 21.09 |
| EBITDA | 18,284.0 | 52,788.0 | 102,591.0 | 74,273.0 | 73,311.0 | 81,212.2 | 98,336.4 | 119,071.5 | 144,178.6 | 174,579.9 |
| EBITDA, % | 10.24 | 19.08 | 25.73 | 22.19 | 21.61 | 19.77 | 19.77 | 19.77 | 19.77 | 19.77 |
| Depreciation | 46,009.0 | 20,607.0 | 24,040.0 | 20,641.0 | 23,442.0 | 42,983.5 | 52,046.9 | 63,021.4 | 76,310.0 | 92,400.6 |
| Depreciation, % | 25.76 | 7.45 | 6.03 | 6.17 | 6.91 | 10.46 | 10.46 | 10.46 | 10.46 | 10.46 |
| EBIT | -27,725.0 | 32,181.0 | 78,551.0 | 53,632.0 | 49,869.0 | 38,228.7 | 46,289.5 | 56,050.0 | 67,868.6 | 82,179.3 |
| EBIT, % | -15.53 | 11.63 | 19.7 | 16.02 | 14.7 | 9.31 | 9.31 | 9.31 | 9.31 | 9.31 |
| Total Cash | 4,364.0 | 6,802.0 | 29,640.0 | 31,539.0 | 23,029.0 | 23,454.0 | 28,399.5 | 34,387.8 | 41,638.7 | 50,418.6 |
| Total Cash, percent | .0 | .0 | .0 | .0 | .0 | .0 | .0 | .0 | .0 | .0 |
| Account Receivables | 20,581.0 | 32,383.0 | 41,749.0 | 38,015.0 | 43,681.0 | 47,596.8 | 57,633.0 | 69,785.4 | 84,500.2 | 102,317.7 |
| Account Receivables, % | 11.53 | 11.7 | 10.47 | 11.36 | 12.88 | 11.59 | 11.59 | 11.59 | 11.59 | 11.59 |
| Inventories | 18,850.0 | 18,780.0 | 24,435.0 | 25,120.0 | 23,524.0 | 31,146.7 | 37,714.3 | 45,666.7 | 55,295.8 | 66,955.4 |
| Inventories, % | 10.56 | 6.79 | 6.13 | 7.51 | 6.93 | 7.58 | 7.58 | 7.58 | 7.58 | 7.58 |
| Accounts Payable | 17,499.0 | 26,623.0 | 33,169.0 | 31,249.0 | 36,145.0 | 39,214.7 | 47,483.4 | 57,495.7 | 69,619.1 | 84,298.9 |
| Accounts Payable, % | 9.8 | 9.62 | 8.32 | 9.34 | 10.65 | 9.55 | 9.55 | 9.55 | 9.55 | 9.55 |
| Capital Expenditure | -17,282.0 | -12,076.0 | -18,407.0 | -21,919.0 | -24,306.0 | -26,596.2 | -32,204.3 | -38,994.8 | -47,217.2 | -57,173.3 |
| Capital Expenditure, % | -9.68 | -4.36 | -4.62 | -6.55 | -7.16 | -6.47 | -6.47 | -6.47 | -6.47 | -6.47 |
| Tax Rate, % | 31.09 | 31.09 | 31.09 | 31.09 | 31.09 | 31.09 | 31.09 | 31.09 | 31.09 | 31.09 |
| EBITAT | -21,540.3 | 23,738.6 | 56,312.1 | 36,589.2 | 34,366.4 | 27,546.3 | 33,354.7 | 40,387.8 | 48,903.8 | 59,215.6 |
| Depreciation | ||||||||||
| Changes in Account Receivables | ||||||||||
| Changes in Inventories | ||||||||||
| Changes in Accounts Payable | ||||||||||
| Capital Expenditure | ||||||||||
| UFCF | -14,745.3 | 29,661.6 | 53,470.1 | 36,440.2 | 34,328.4 | 35,464.7 | 44,862.3 | 54,321.9 | 65,776.1 | 79,645.6 |
| WACC, % | 5.33 | 5.32 | 5.31 | 5.3 | 5.3 | 5.31 | 5.31 | 5.31 | 5.31 | 5.31 |
| PV UFCF | ||||||||||
| SUM PV UFCF | 235,602.2 | |||||||||
| Long Term Growth Rate, % | 2.00 | |||||||||
| Free cash flow (T + 1) | 81,238 | |||||||||
| Terminal Value | 2,453,363 | |||||||||
| Present Terminal Value | 1,894,029 | |||||||||
| Enterprise Value | 2,129,632 | |||||||||
| Net Debt | 18,681 | |||||||||
| Equity Value | 2,110,951 | |||||||||
| Diluted Shares Outstanding, MM | 4,298 | |||||||||
| Equity Value Per Share | 491.15 |
What You Will Get
- Real Exxon Mobil Data: Preloaded financials – from revenue to EBIT – based on actual and projected figures for Exxon Mobil Corporation (XOM).
- Full Customization: Adjust all critical parameters (yellow cells) like WACC, growth %, and tax rates specific to Exxon Mobil Corporation (XOM).
- Instant Valuation Updates: Automatic recalculations to analyze the impact of changes on Exxon Mobil Corporation (XOM)’s fair value.
- Versatile Excel Template: Tailored for quick edits, scenario testing, and detailed projections for Exxon Mobil Corporation (XOM).
- Time-Saving and Accurate: Skip building models from scratch while maintaining precision and flexibility for Exxon Mobil Corporation (XOM).
Key Features
- Comprehensive DCF Calculator: Features both unlevered and levered DCF valuation models tailored for Exxon Mobil Corporation (XOM).
- WACC Calculator: Ready-to-use Weighted Average Cost of Capital sheet with adjustable parameters.
- Customizable Forecast Assumptions: Adjust growth rates, capital expenditures, and discount rates as needed.
- Integrated Financial Ratios: Evaluate profitability, leverage, and efficiency ratios specifically for Exxon Mobil Corporation (XOM).
- Interactive Dashboard and Charts: Visual representations of essential valuation metrics for straightforward analysis.
How It Works
- Step 1: Download the Excel file.
- Step 2: Review Exxon Mobil Corporation’s (XOM) pre-filled financial data and projections.
- Step 3: Adjust key inputs such as revenue growth, WACC, and tax rates (highlighted cells).
- Step 4: Observe the DCF model refresh in real-time as you modify your assumptions.
- Step 5: Evaluate the outputs and leverage the findings for your investment choices.
Why Choose This Calculator?
- Accurate Data: Authentic Exxon Mobil financials guarantee trustworthy valuation outcomes.
- Customizable: Modify essential parameters such as growth rates, WACC, and tax rates to align with your forecasts.
- Time-Saving: Pre-configured calculations save you the hassle of starting from the ground up.
- Professional-Grade Tool: Tailored for investors, analysts, and consultants in the energy sector.
- User-Friendly: Simple interface and guided instructions ensure ease of use for everyone.
Who Should Use Exxon Mobil Corporation (XOM)?
- Investors: Gain insights into energy sector investments with reliable data and analysis.
- Financial Analysts: Utilize comprehensive reports to enhance your market assessments.
- Energy Consultants: Tailor insights from Exxon Mobil (XOM) for strategic client recommendations.
- Energy Sector Enthusiasts: Explore the dynamics of the oil and gas industry through real-time information.
- Educators and Students: Leverage Exxon Mobil (XOM) case studies for academic projects in finance and energy courses.
What the Template Contains
- Comprehensive DCF Model: Editable template with detailed valuation calculations tailored for Exxon Mobil Corporation (XOM).
- Real-World Data: Exxon Mobil's historical and projected financials preloaded for thorough analysis.
- Customizable Parameters: Adjust WACC, growth rates, and tax assumptions to explore various scenarios.
- Financial Statements: Complete annual and quarterly breakdowns for enhanced insights.
- Key Ratios: Integrated analysis for profitability, efficiency, and leverage metrics.
- Dashboard with Visual Outputs: Charts and tables designed for clear, actionable results.
Disclaimer
All information, articles, and product details provided on this website are for general informational and educational purposes only. We do not claim any ownership over, nor do we intend to infringe upon, any trademarks, copyrights, logos, brand names, or other intellectual property mentioned or depicted on this site. Such intellectual property remains the property of its respective owners, and any references here are made solely for identification or informational purposes, without implying any affiliation, endorsement, or partnership.
We make no representations or warranties, express or implied, regarding the accuracy, completeness, or suitability of any content or products presented. Nothing on this website should be construed as legal, tax, investment, financial, medical, or other professional advice. In addition, no part of this site—including articles or product references—constitutes a solicitation, recommendation, endorsement, advertisement, or offer to buy or sell any securities, franchises, or other financial instruments, particularly in jurisdictions where such activity would be unlawful.
All content is of a general nature and may not address the specific circumstances of any individual or entity. It is not a substitute for professional advice or services. Any actions you take based on the information provided here are strictly at your own risk. You accept full responsibility for any decisions or outcomes arising from your use of this website and agree to release us from any liability in connection with your use of, or reliance upon, the content or products found herein.